All your investments. One dashboard that explains it.
Import DEGIRO, Trading 212 or Interactive Brokers and see the return on your deposits, fees, dividends and risk. Compare with the index, follow superinvestors and politicians, and keep up with the economy. No advice, just the numbers.
No payment method required. Afterwards, continue free or from €7.99 per month, cancel monthly.
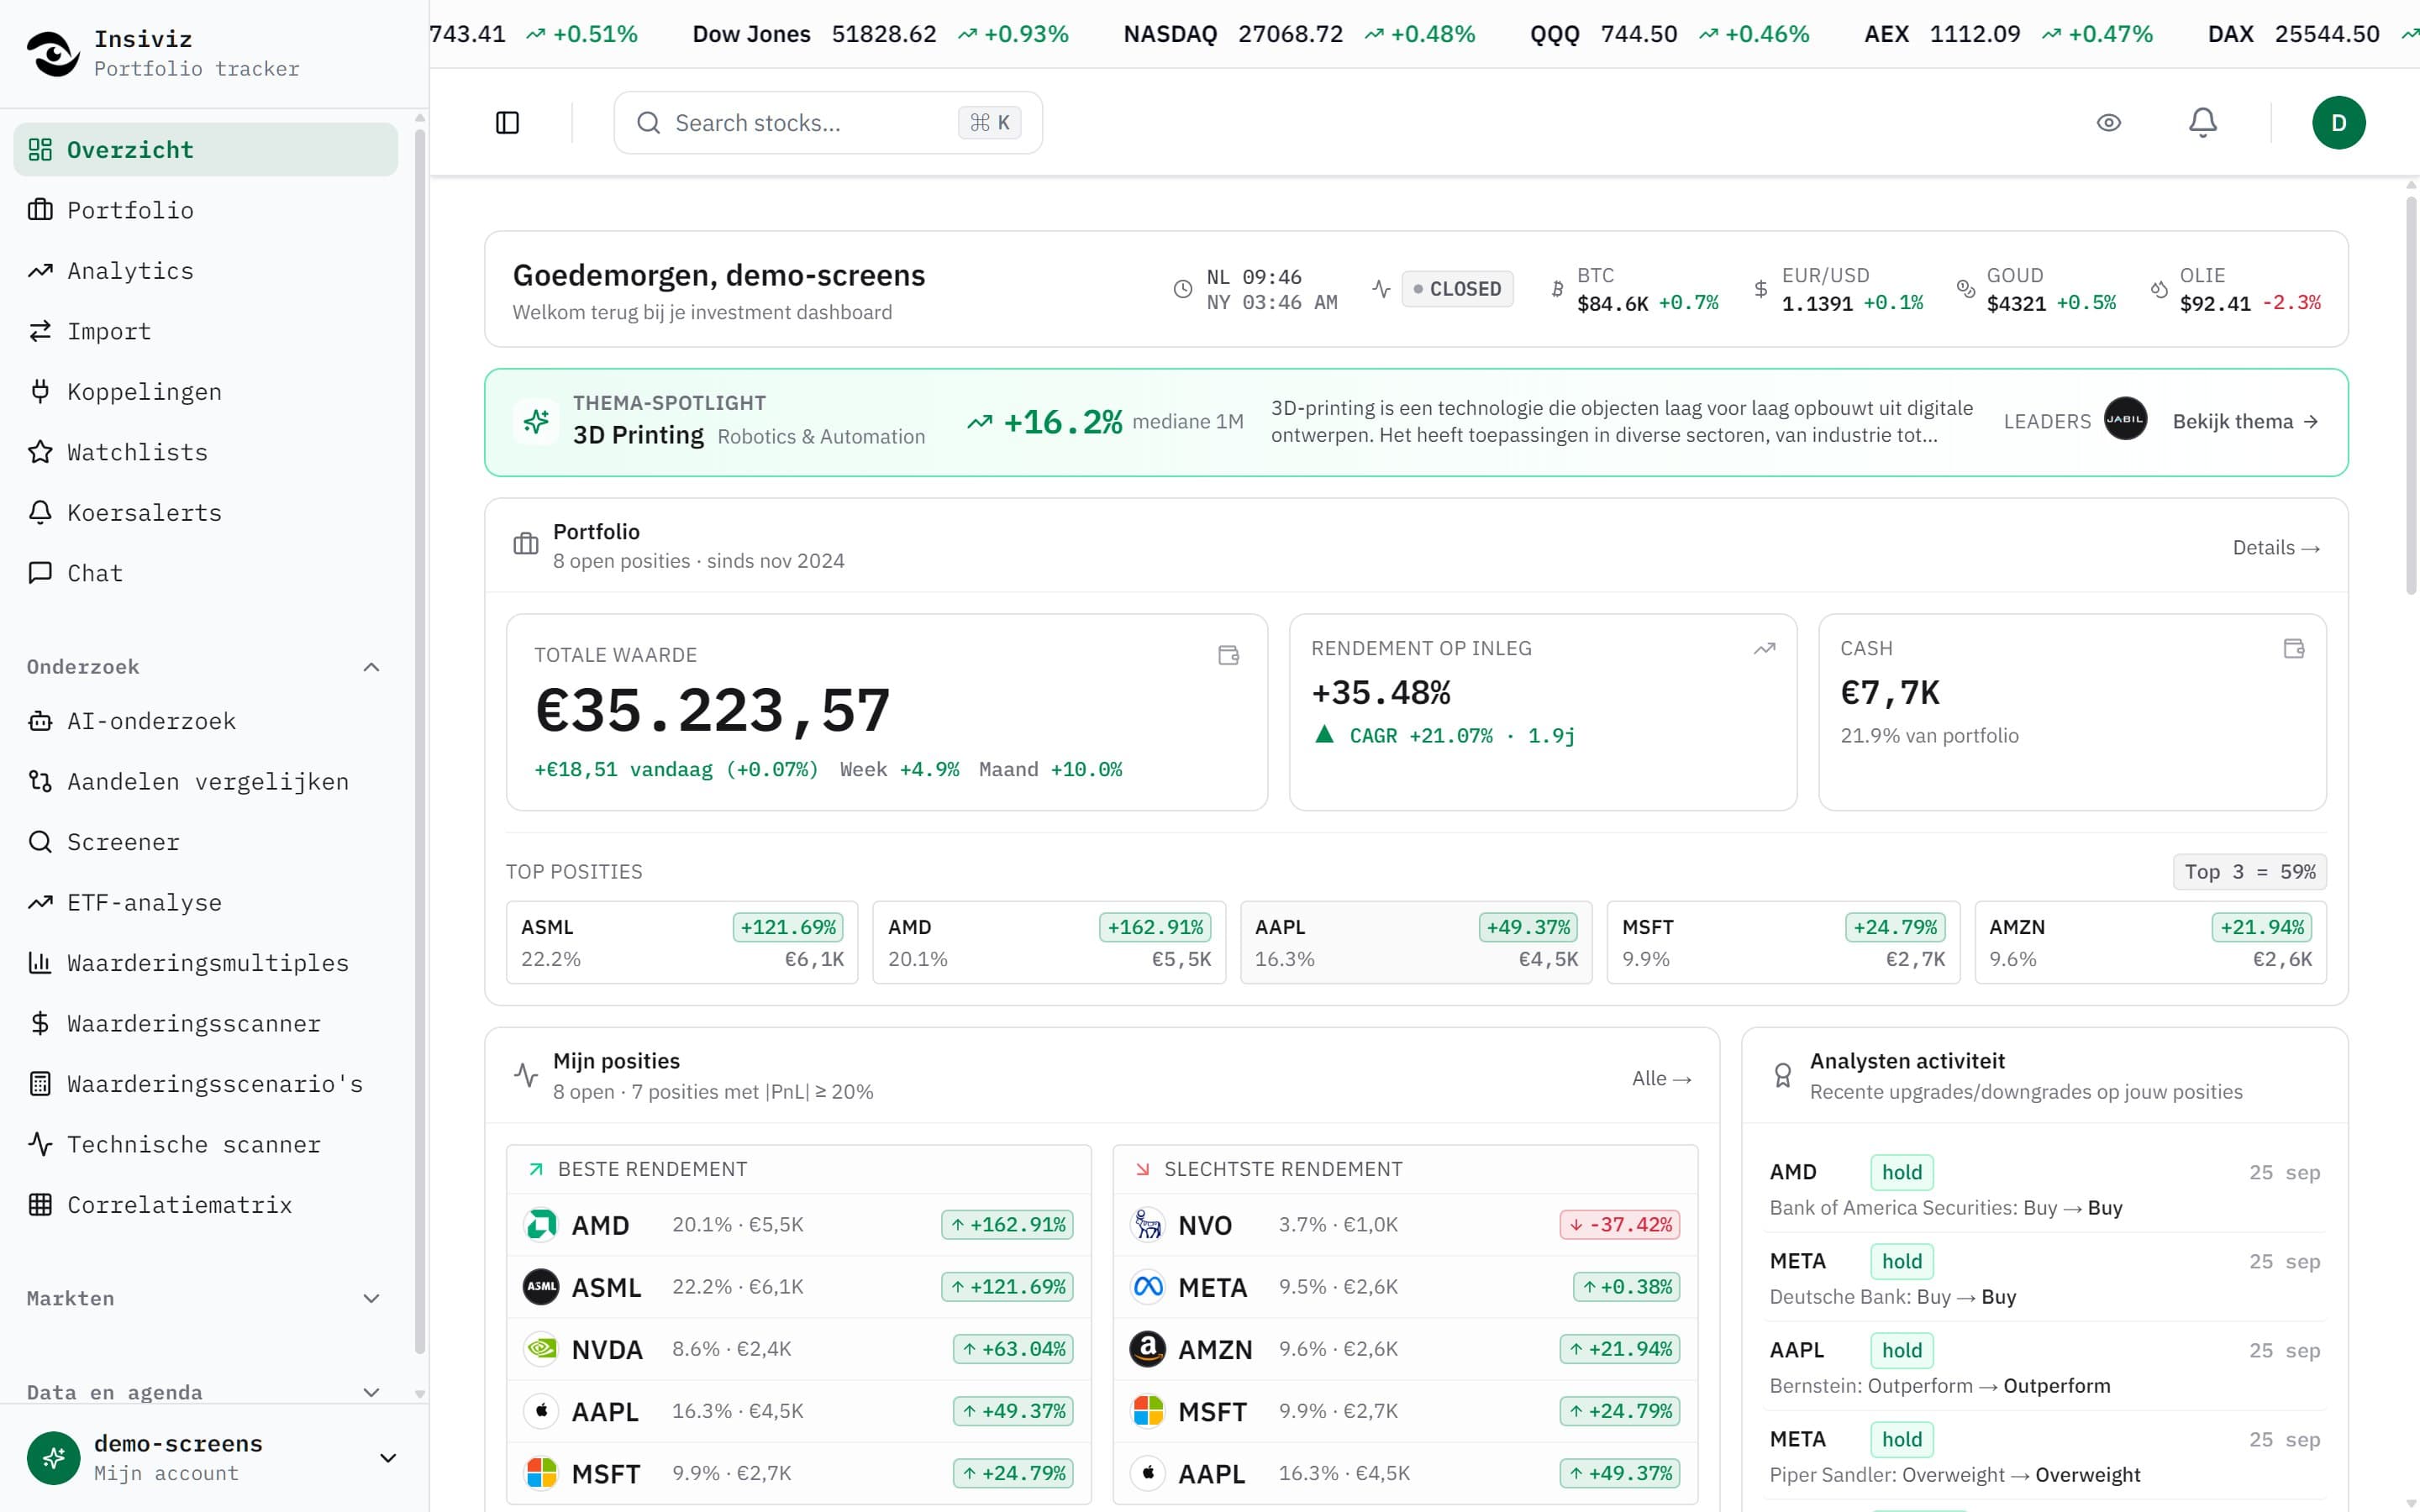
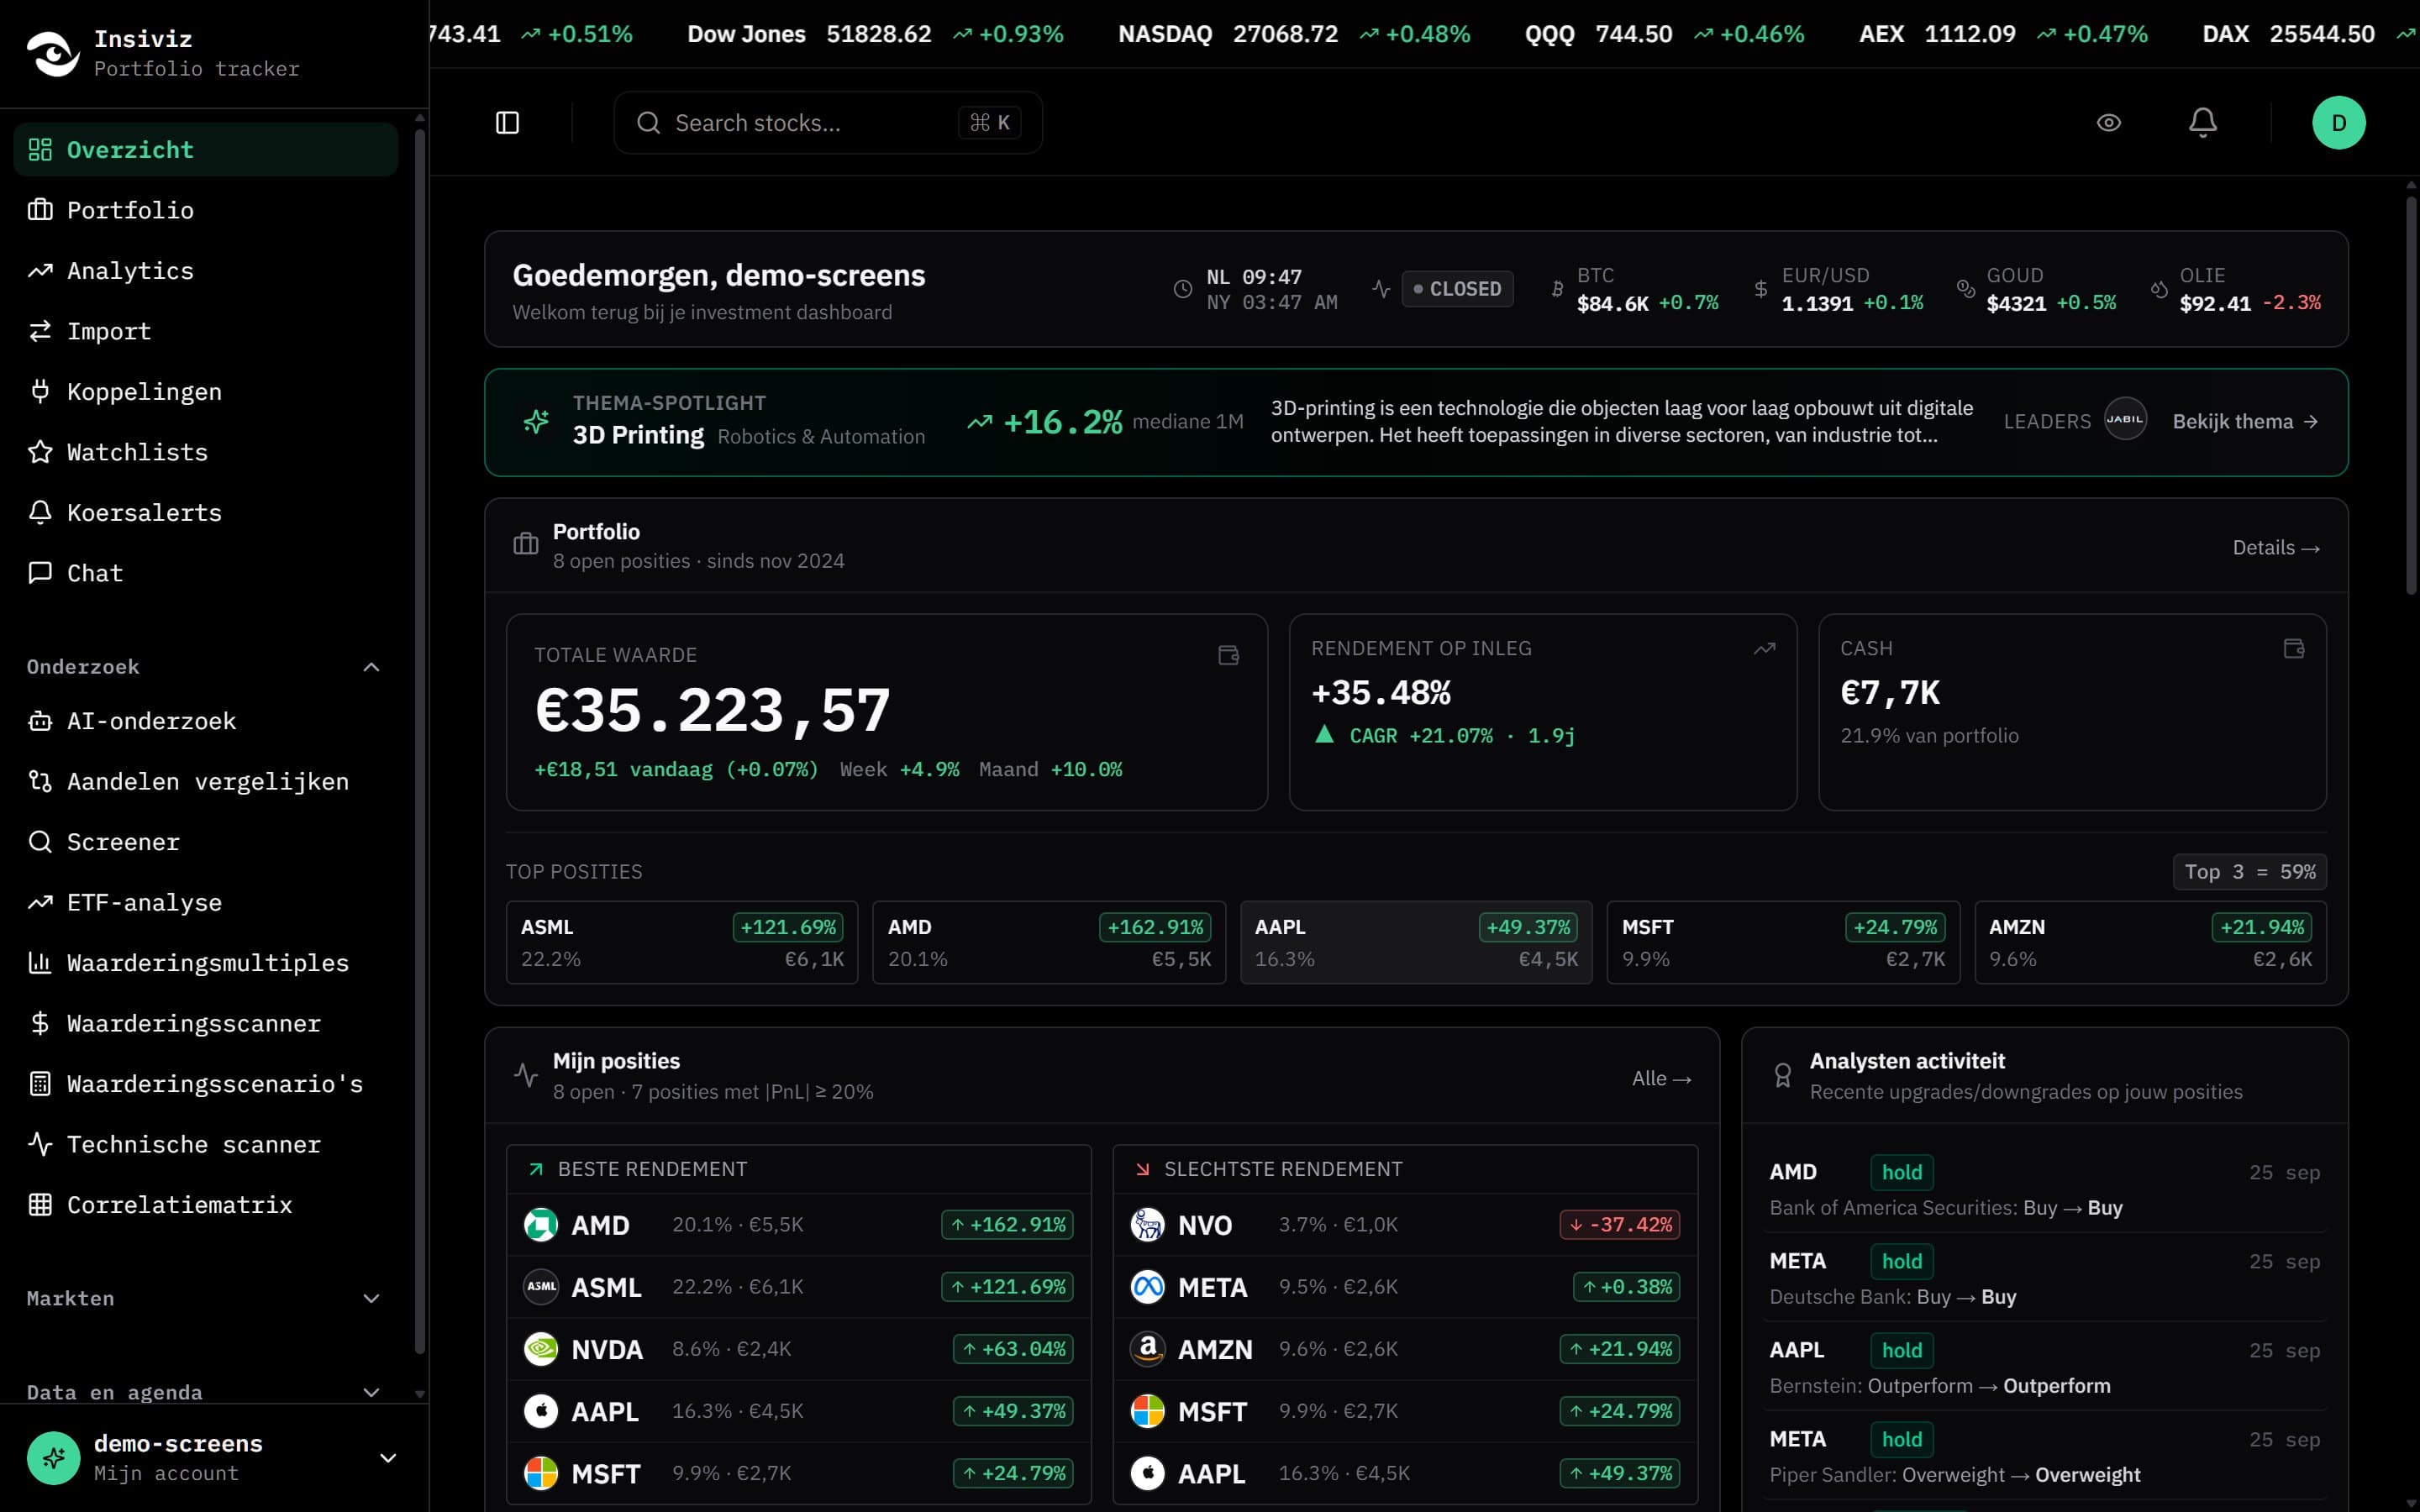
What you get today
No mockups: these are screens from the app with a demo portfolio. Everything you see is calculated from your own transactions.
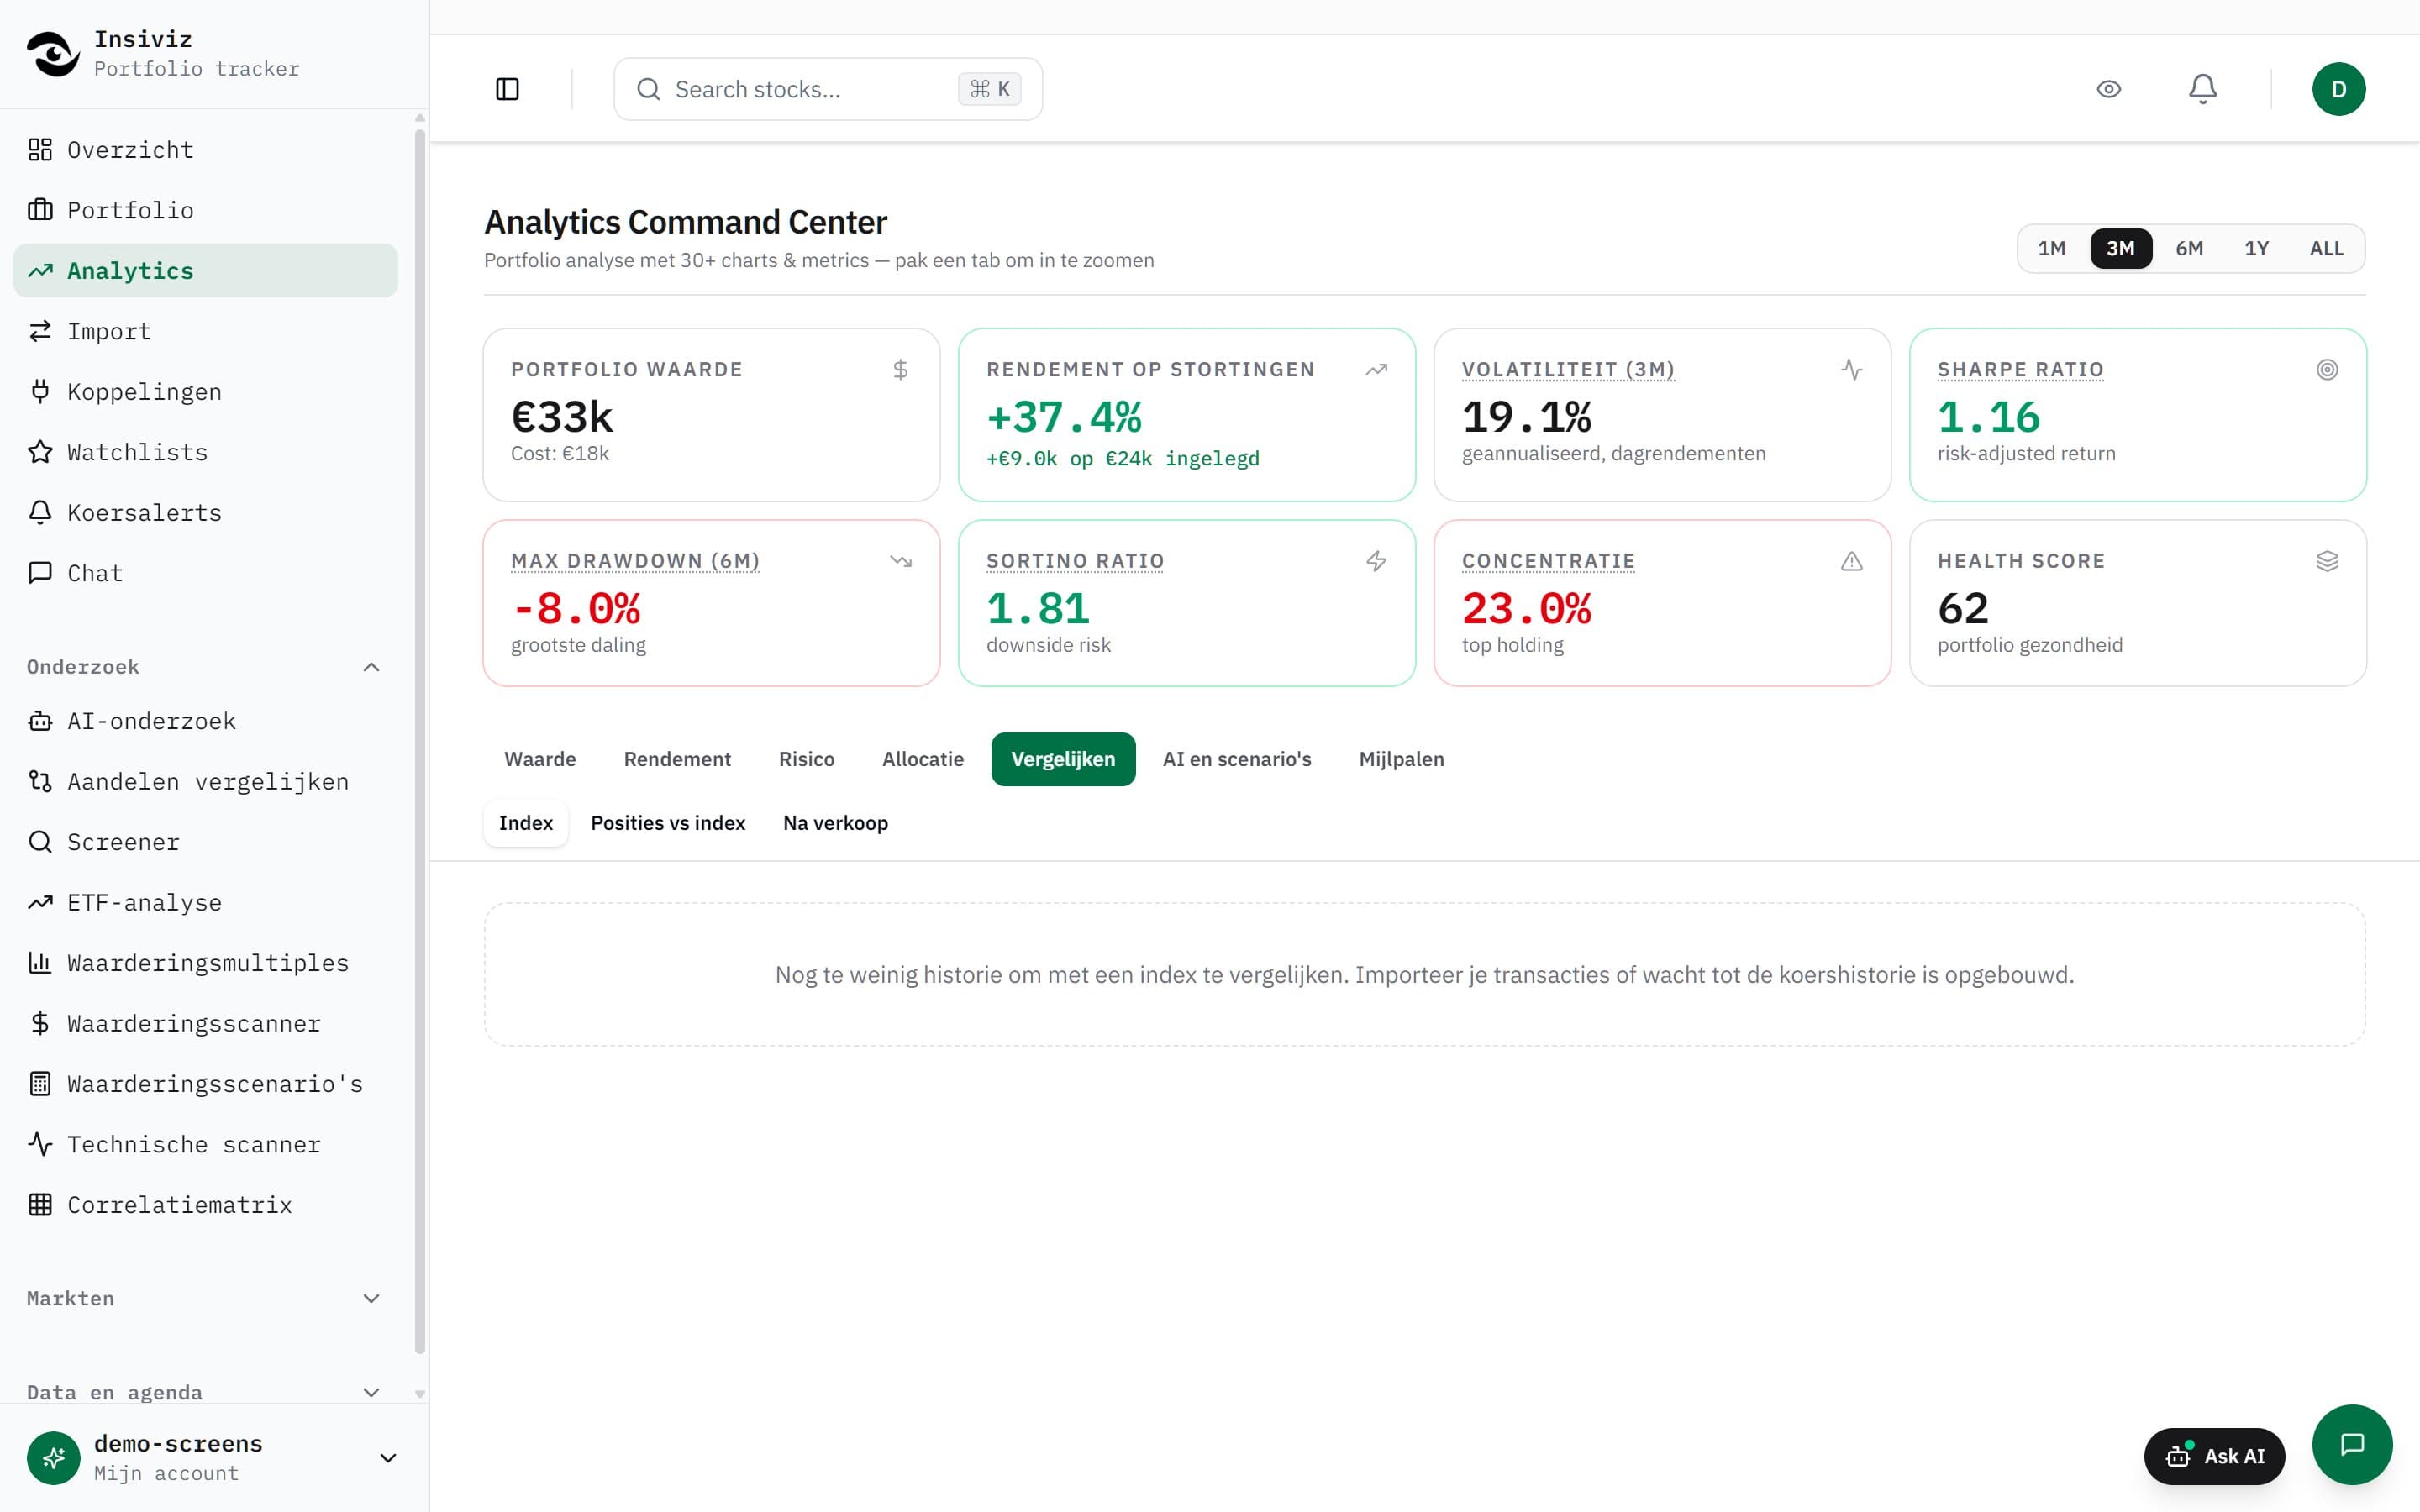
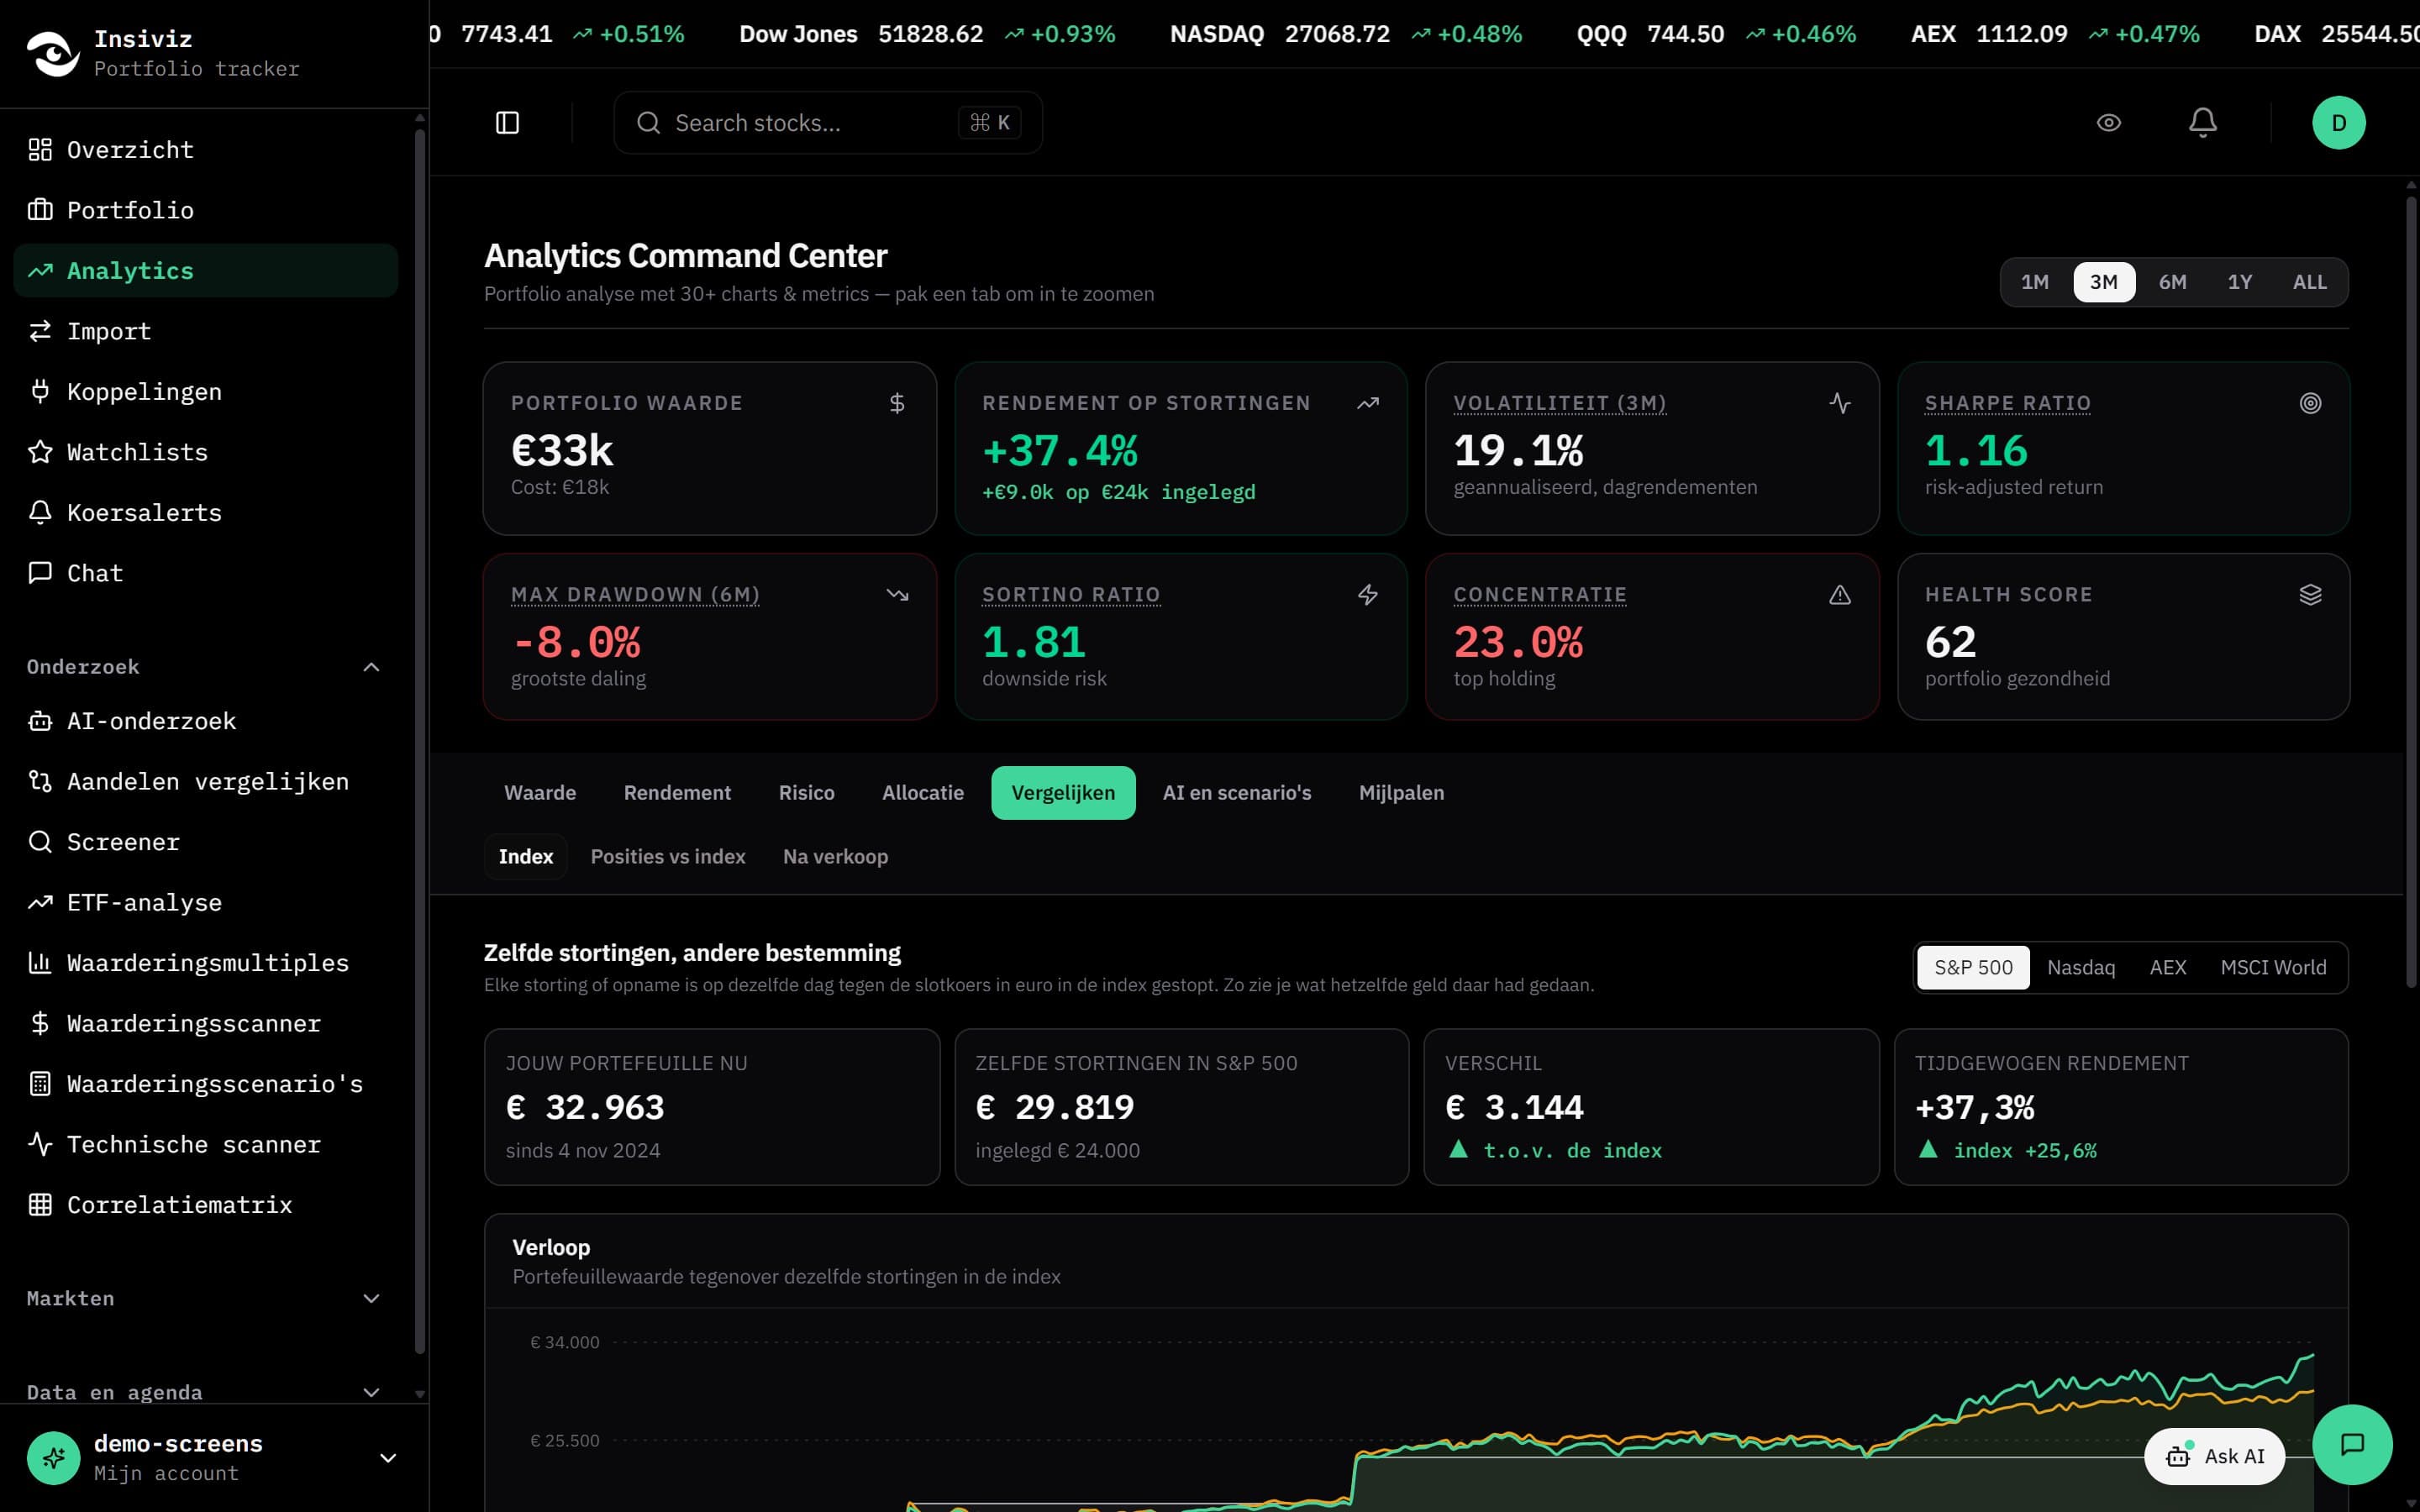
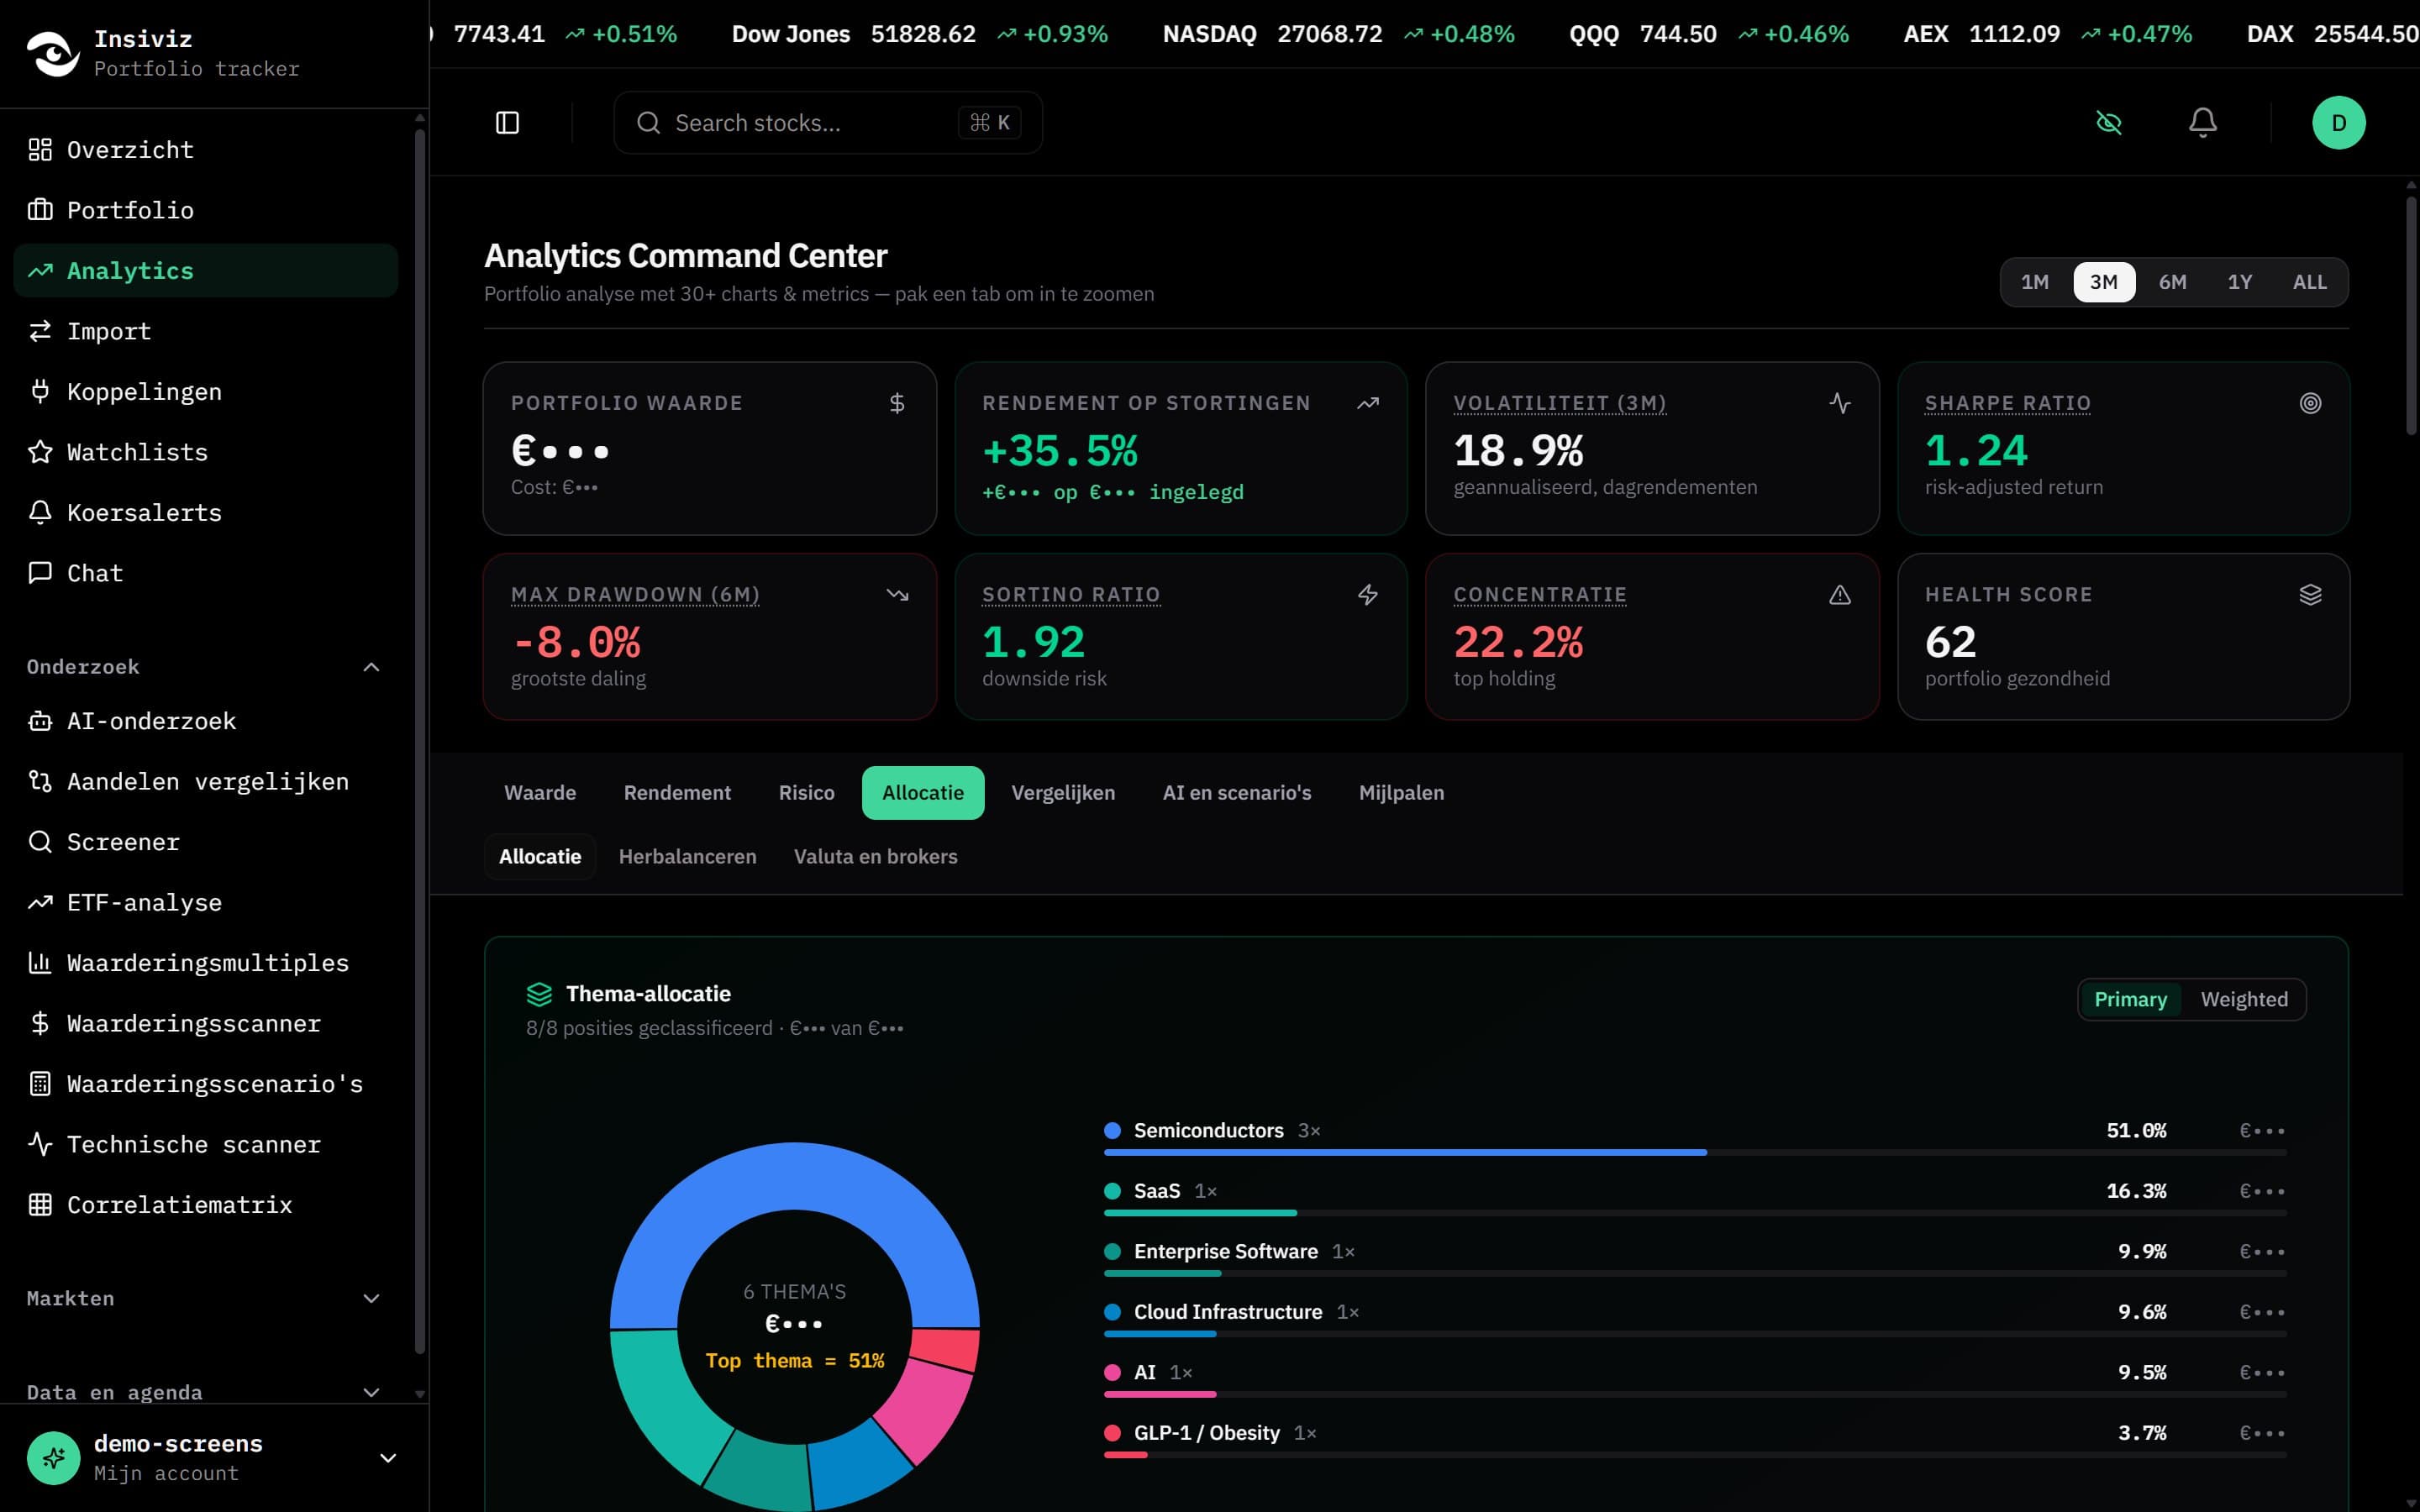
Analytics Command Center
The same deposits in the S&P 500 or AEX, time-weighted return, profit buffer per position and what the price did after you sold.
View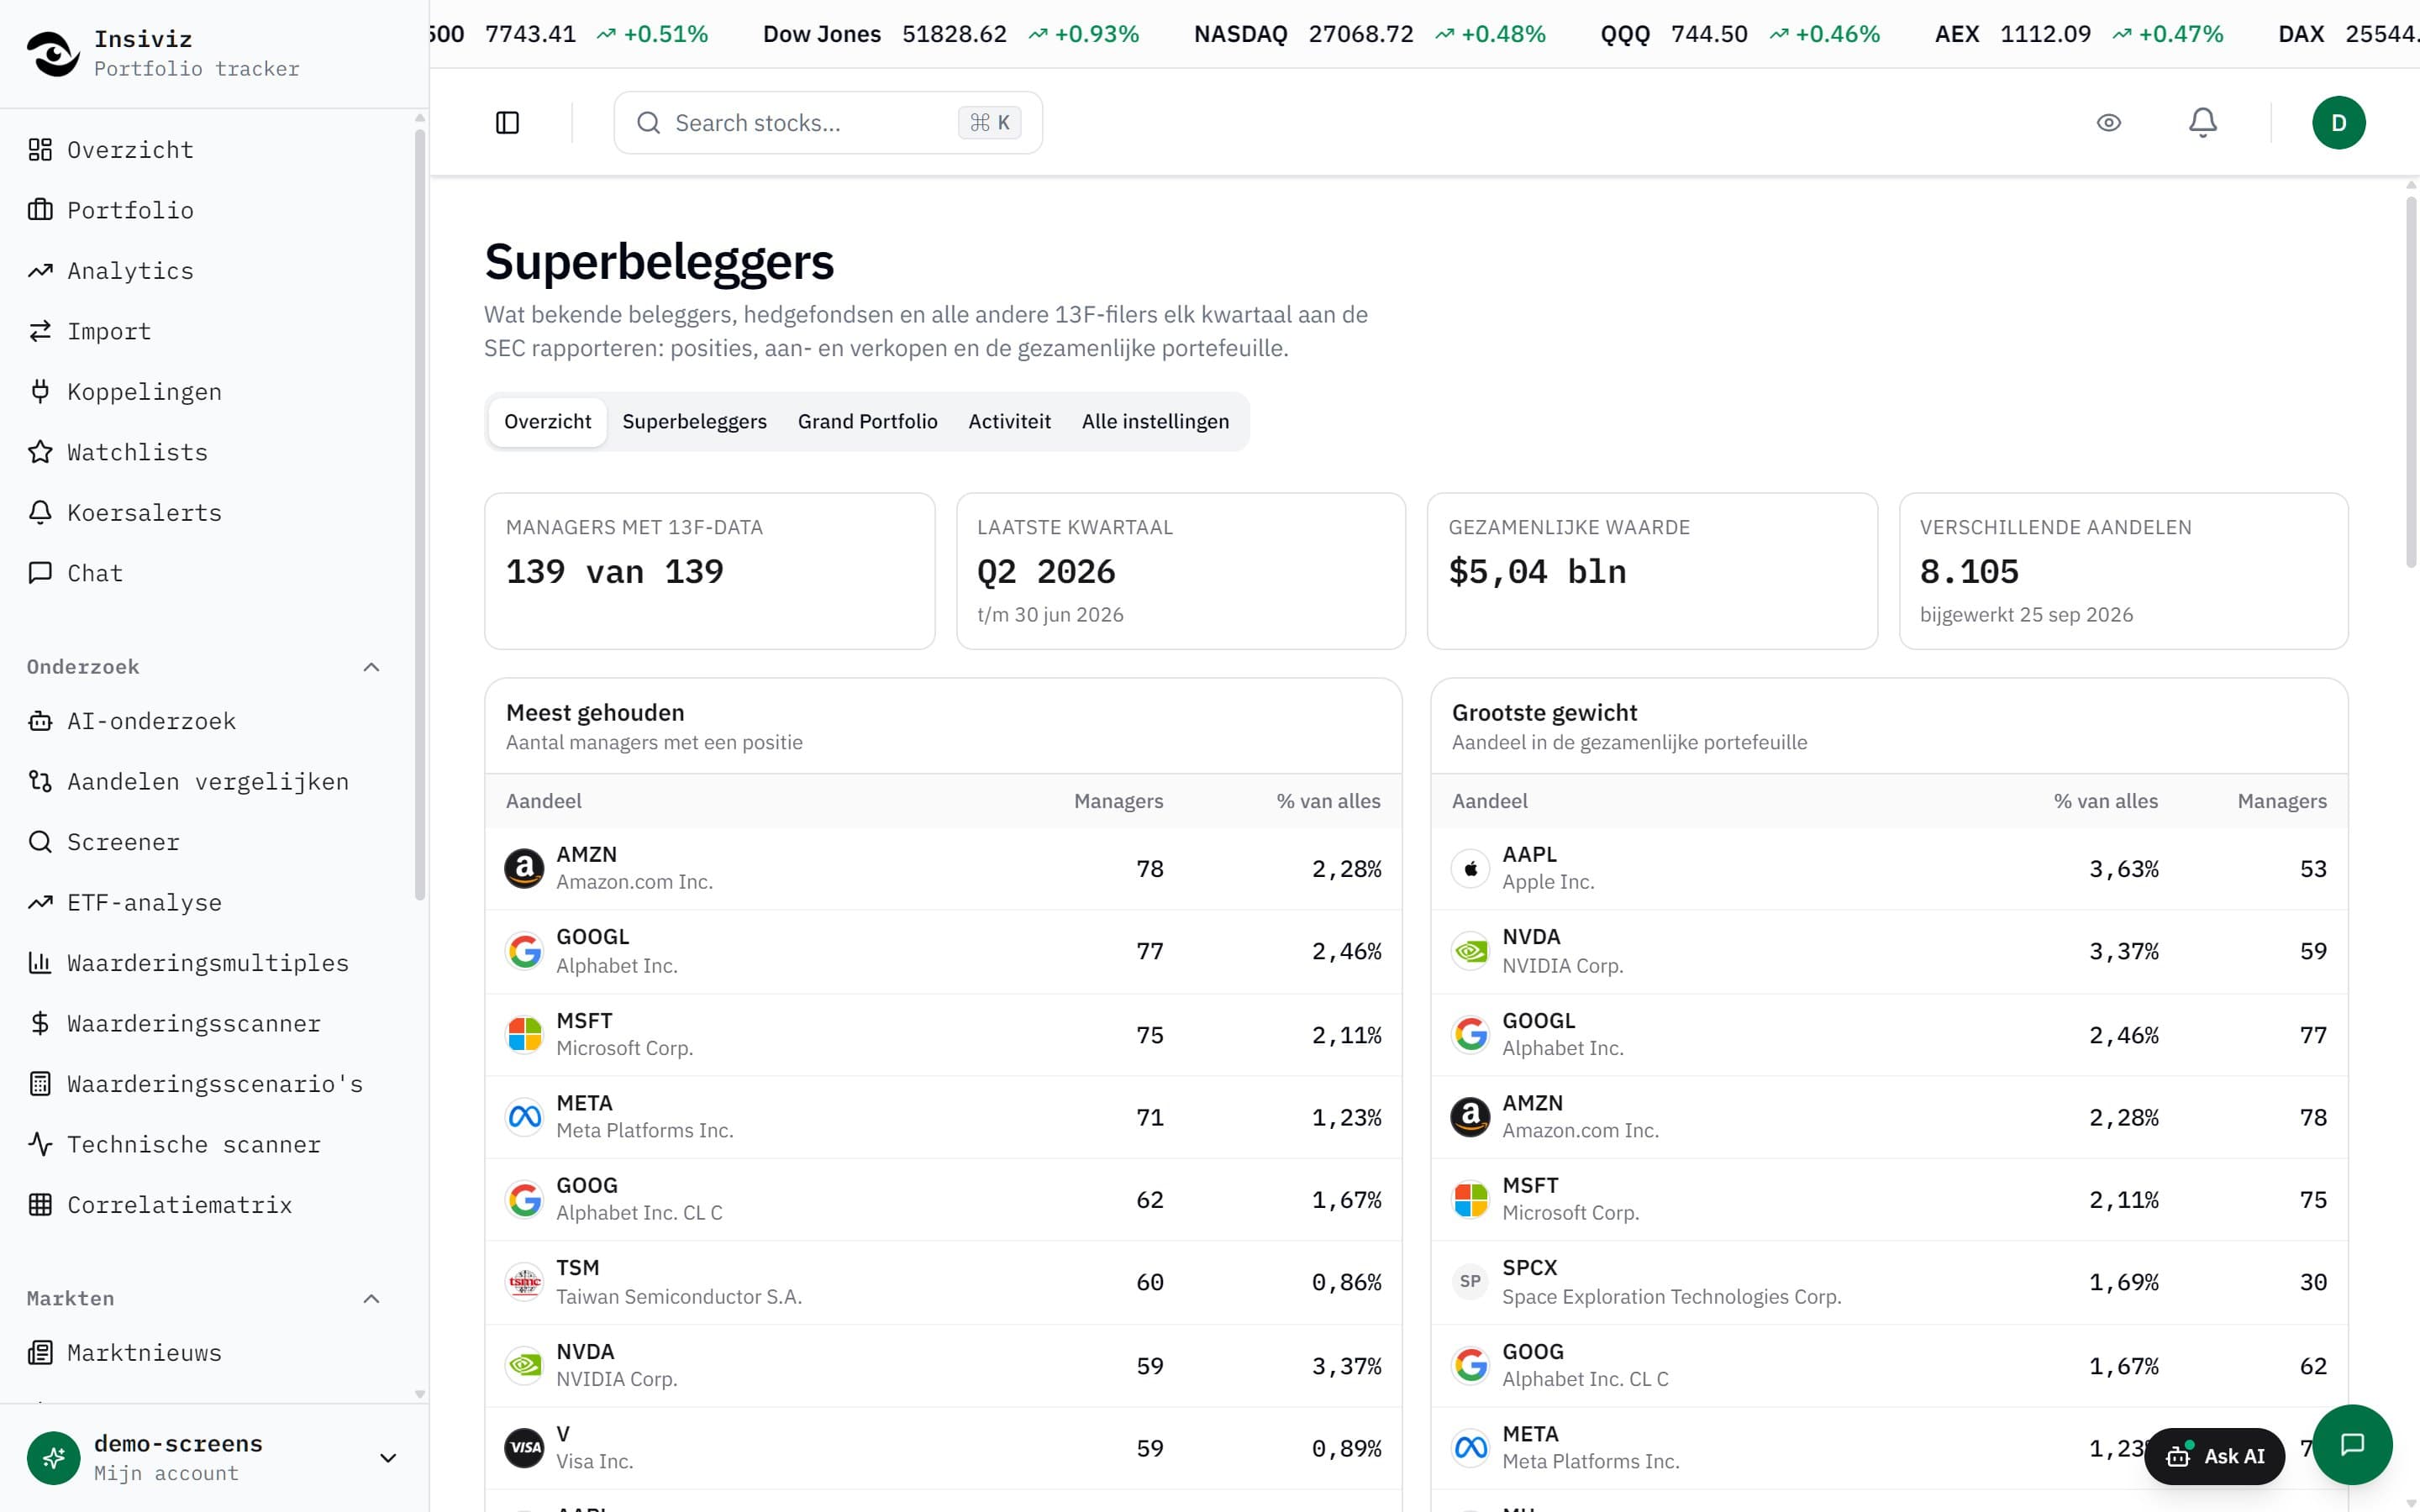
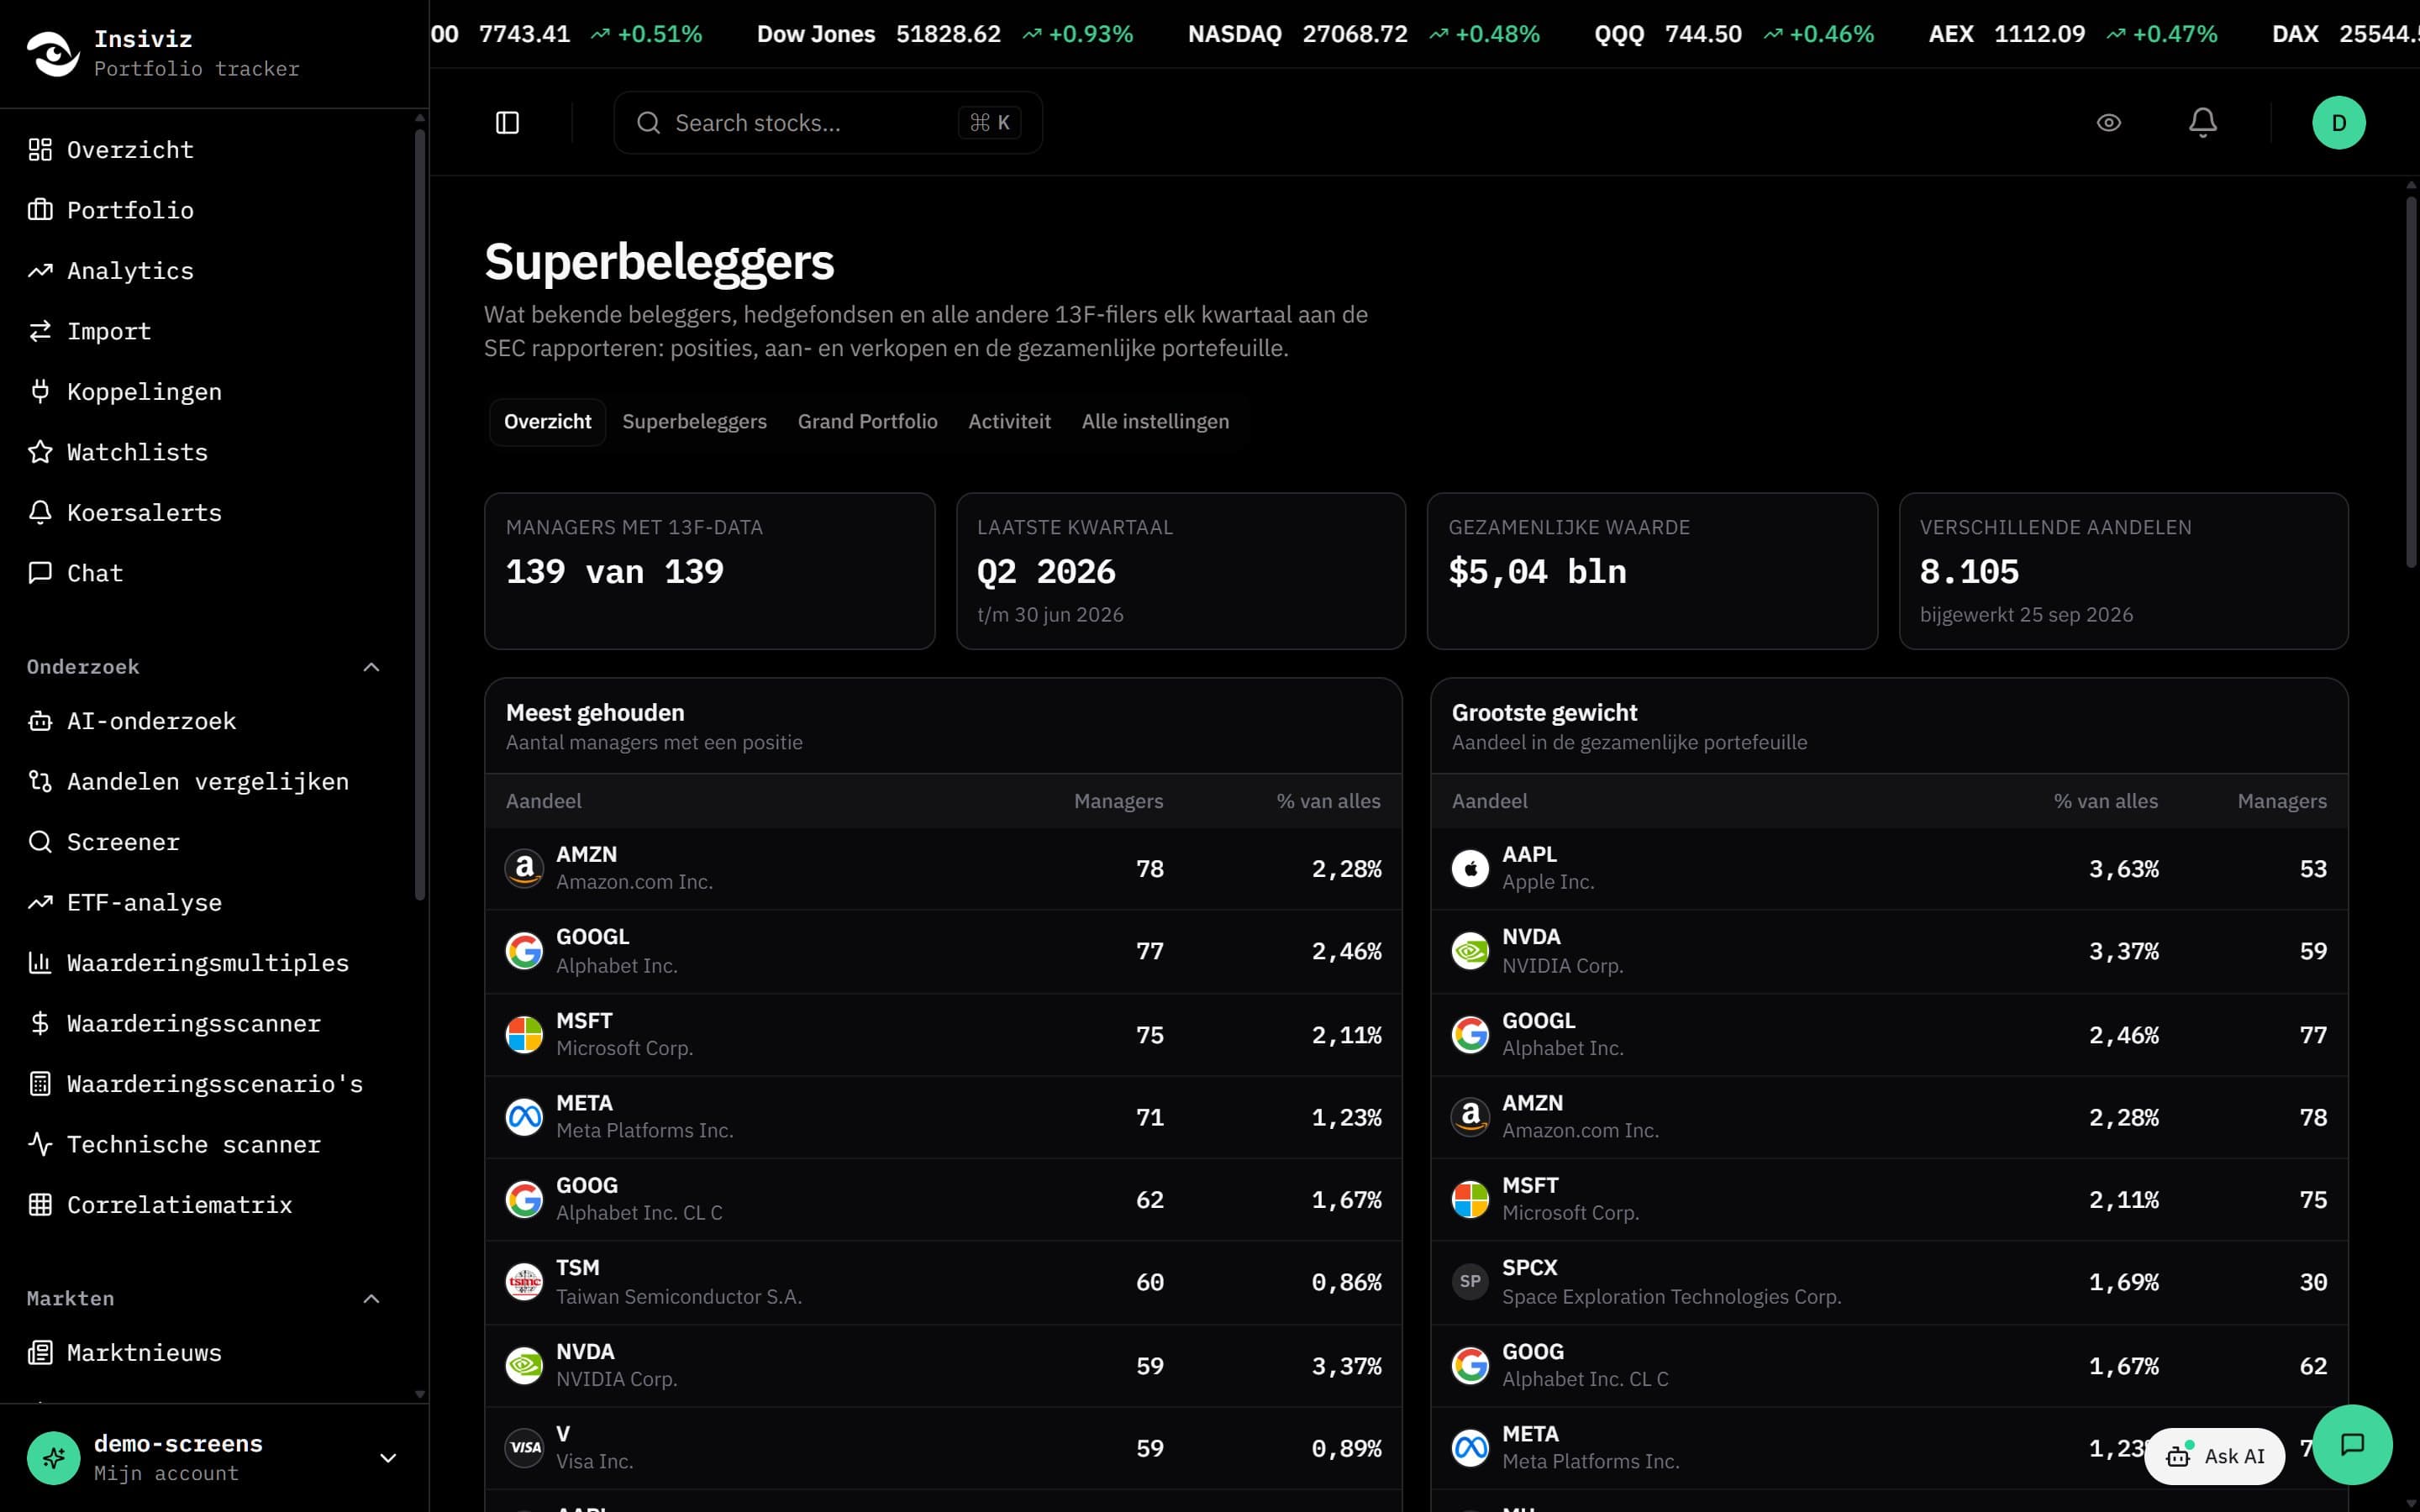
Superinvestors
The portfolios of 139 well-known managers, pulled automatically from SEC filings every quarter. Who is buying what, and how much it weighs.
View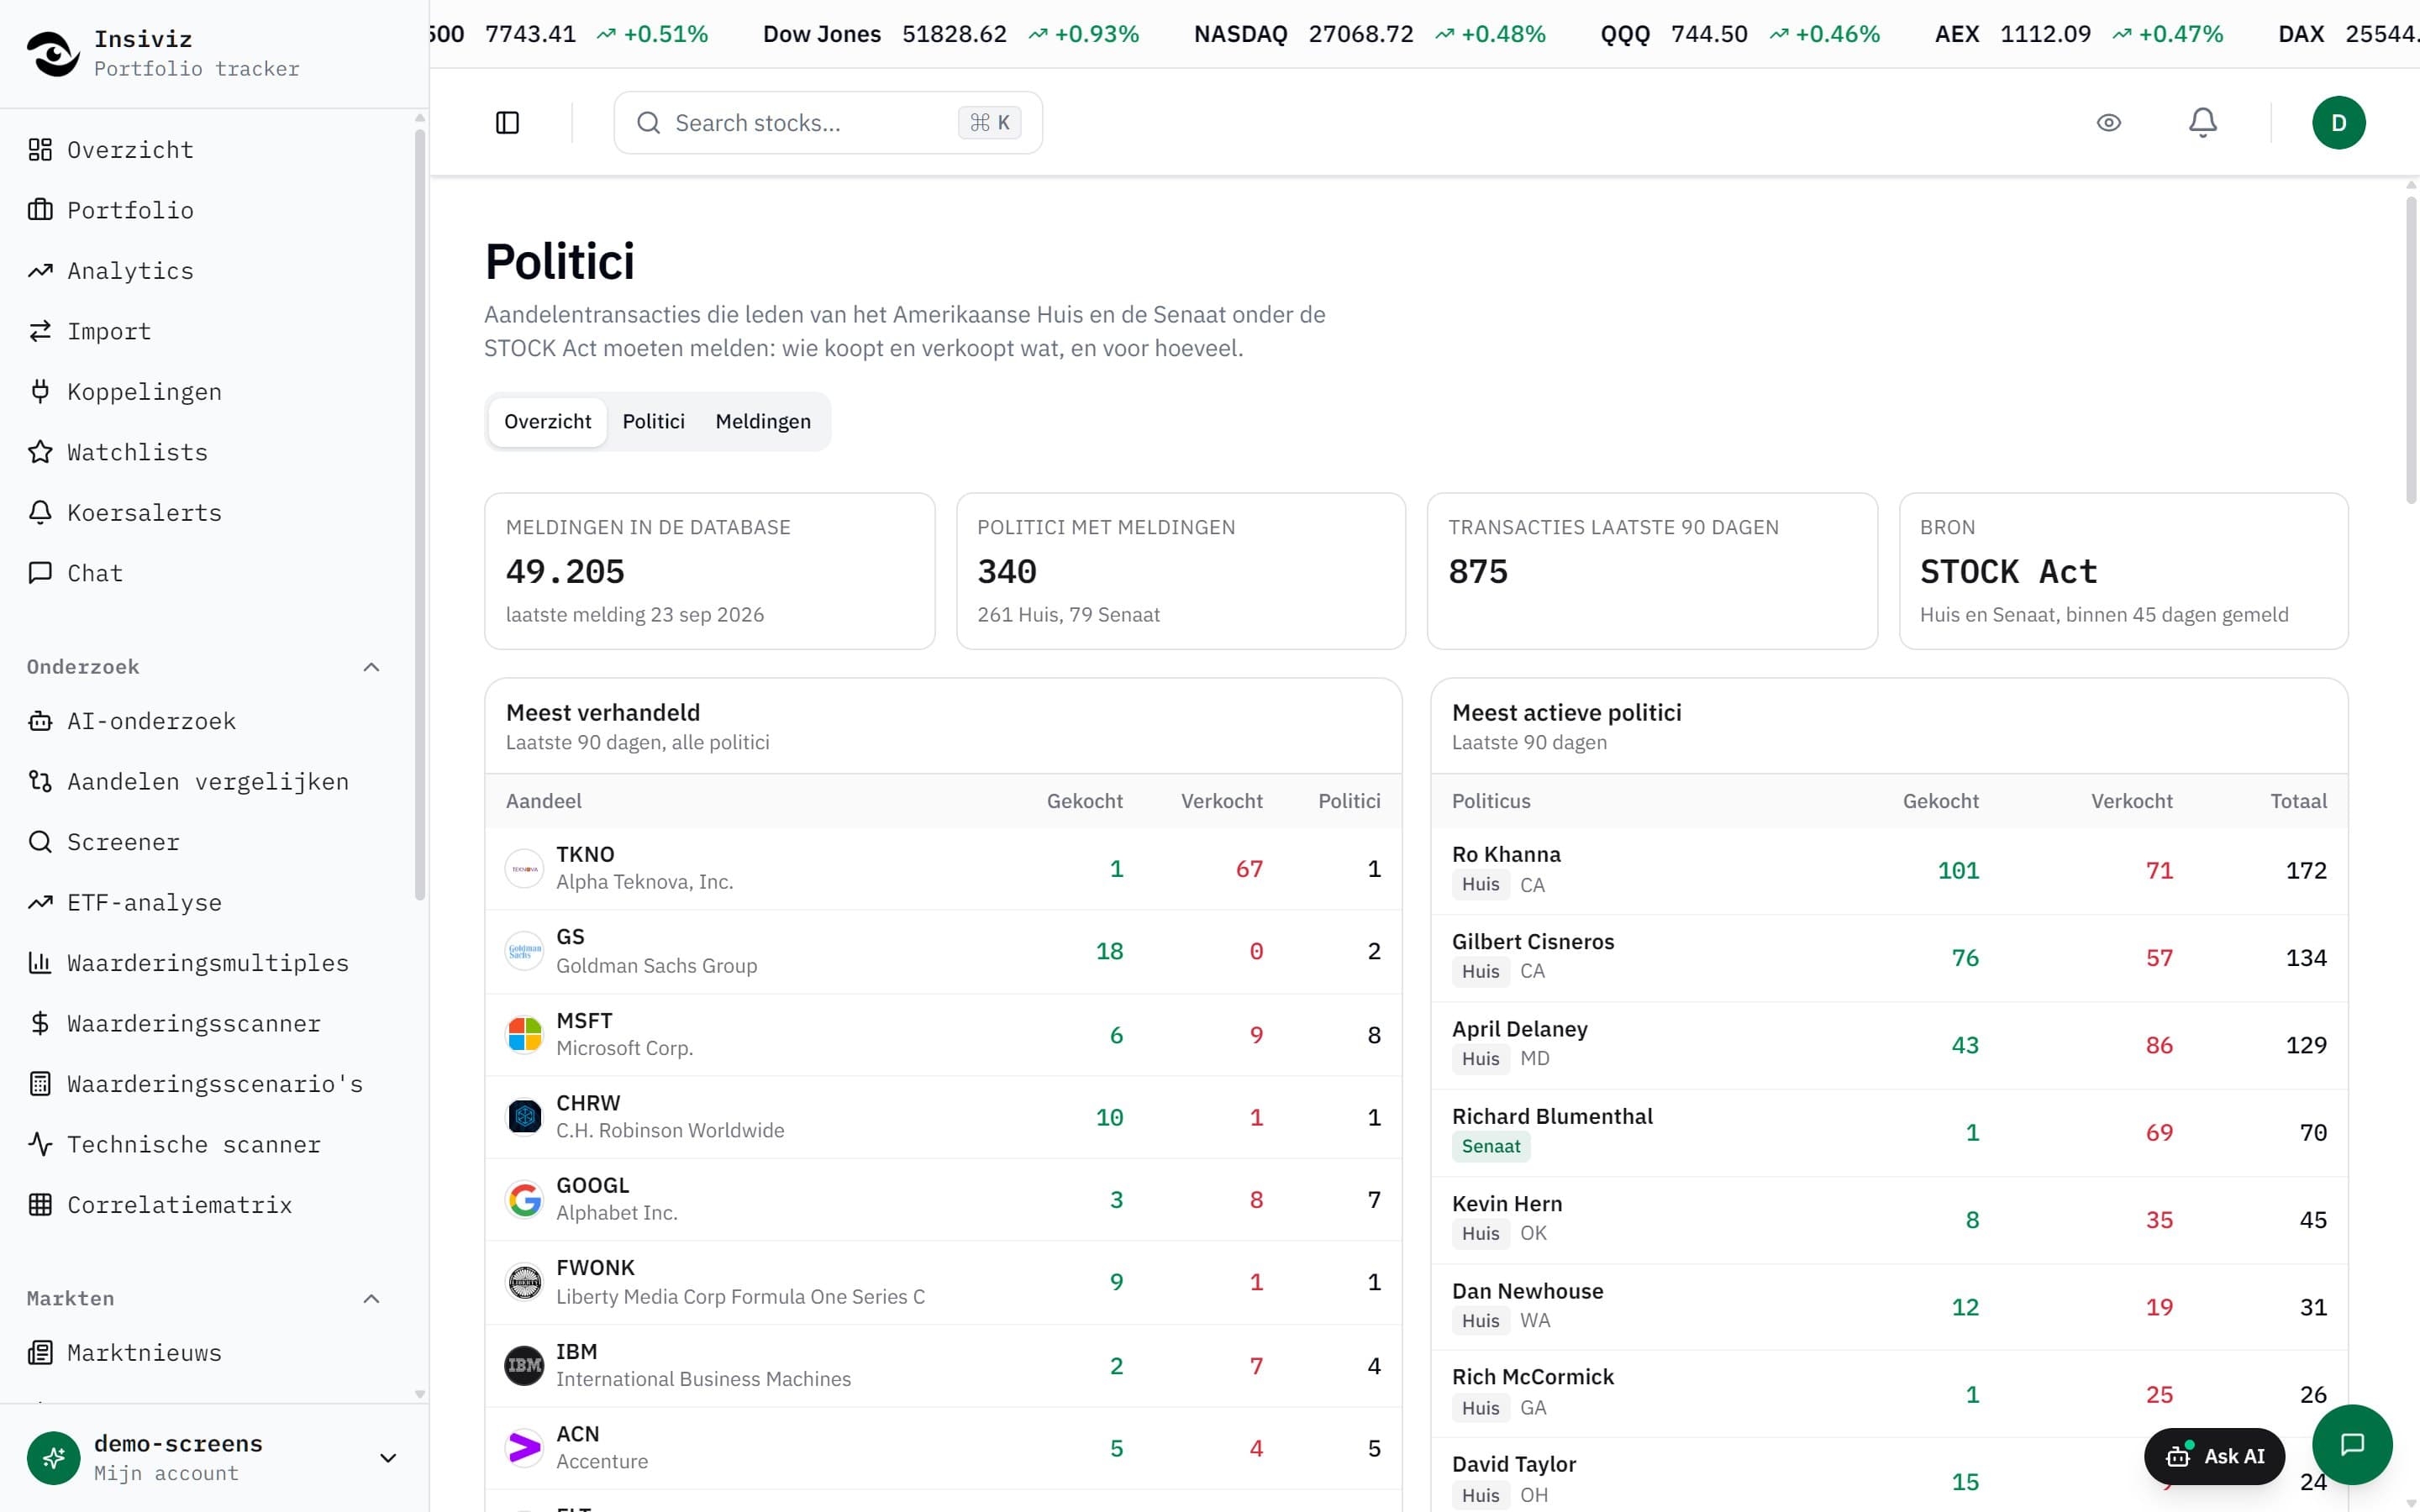
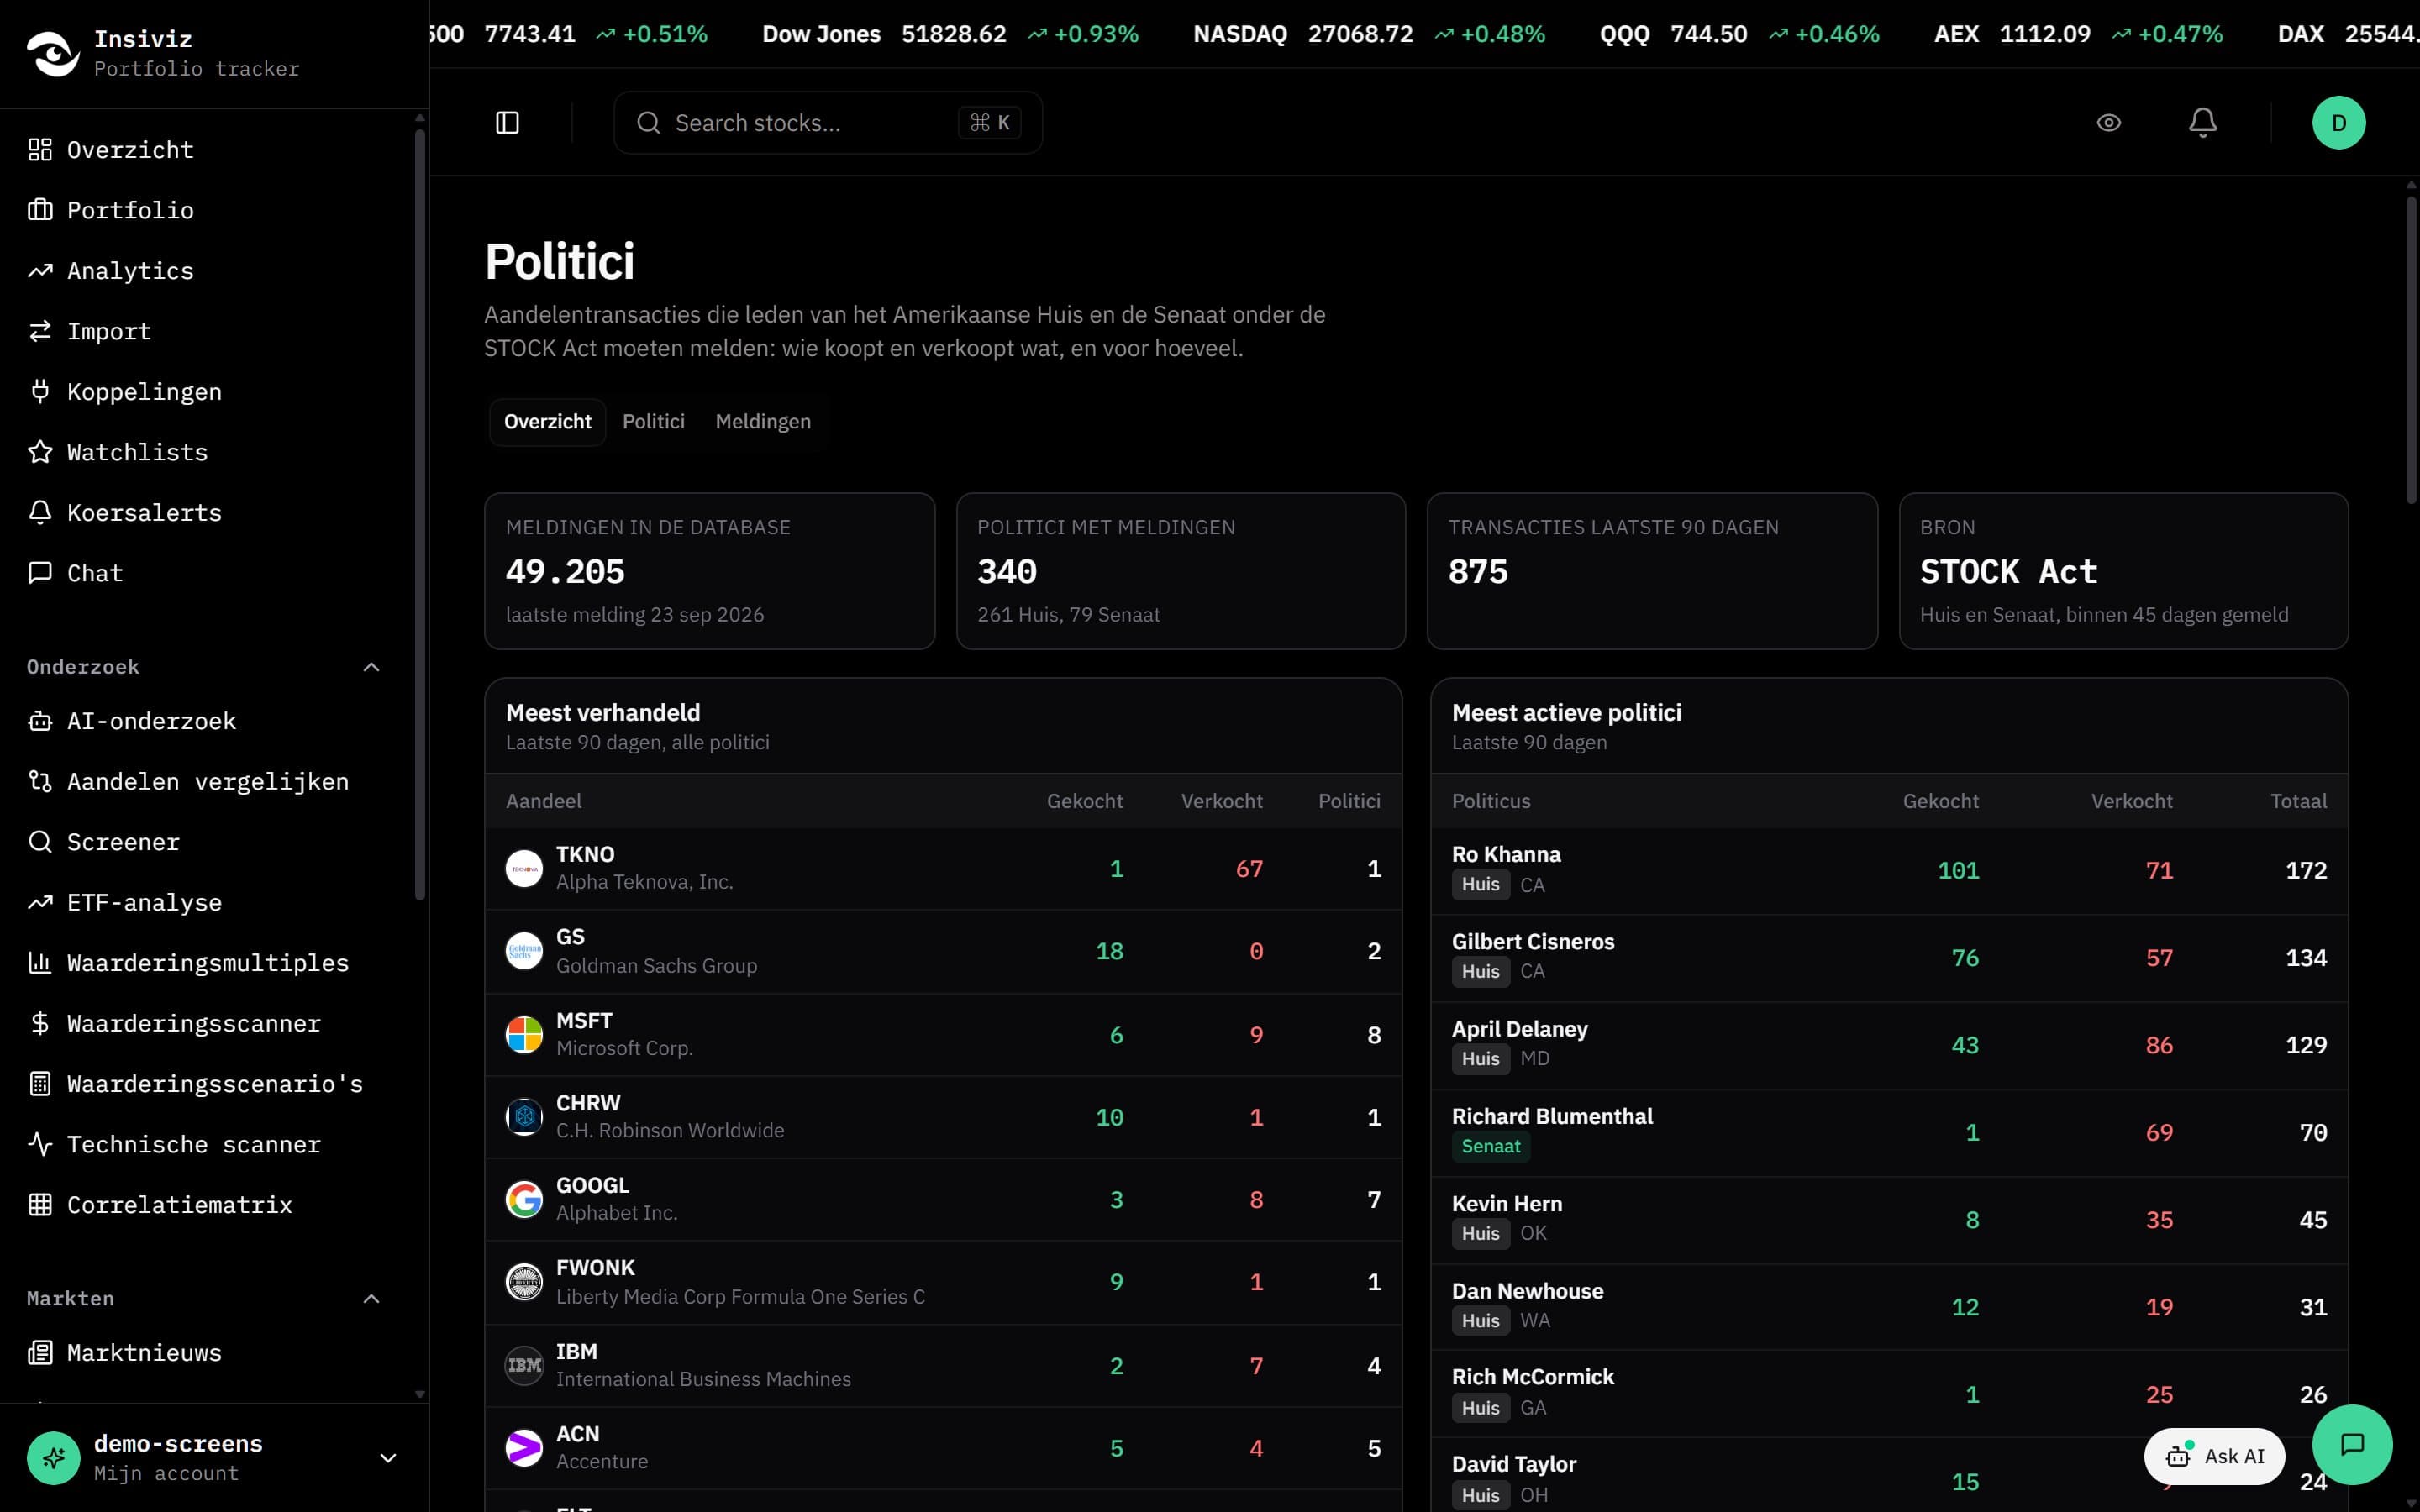
Politicians
Stock trades by members of the US Congress, with how often each person's trades worked out.
View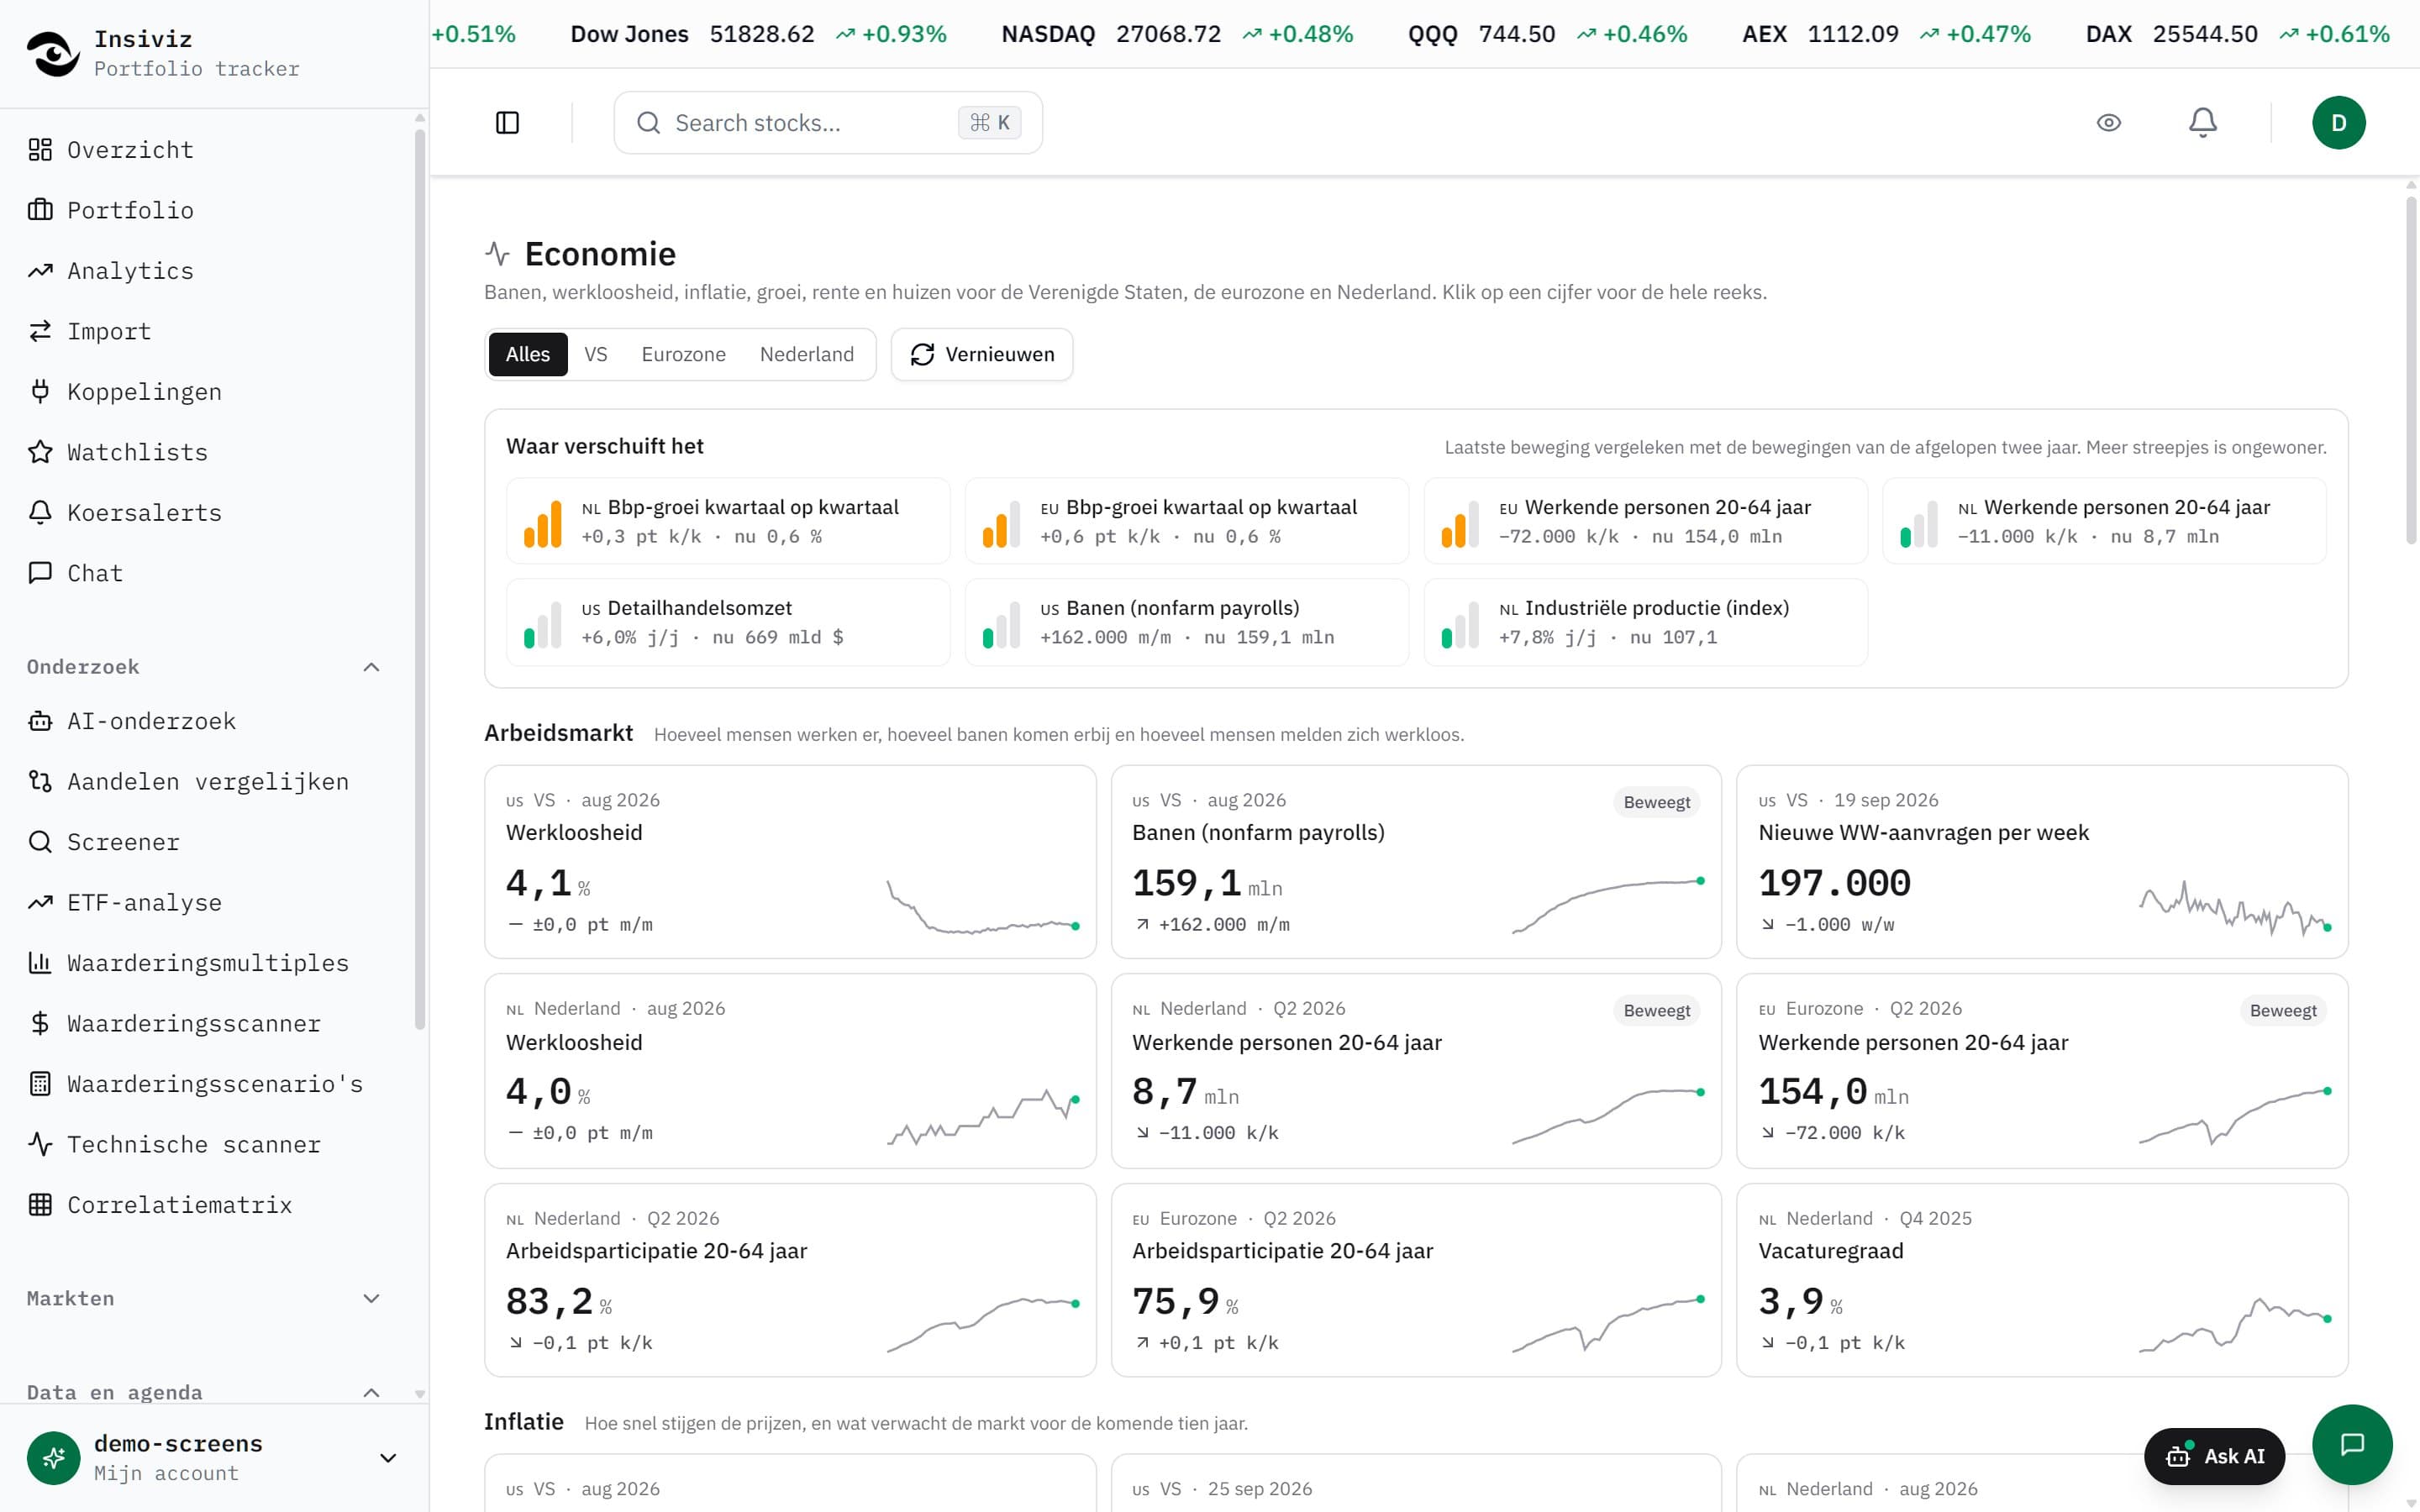
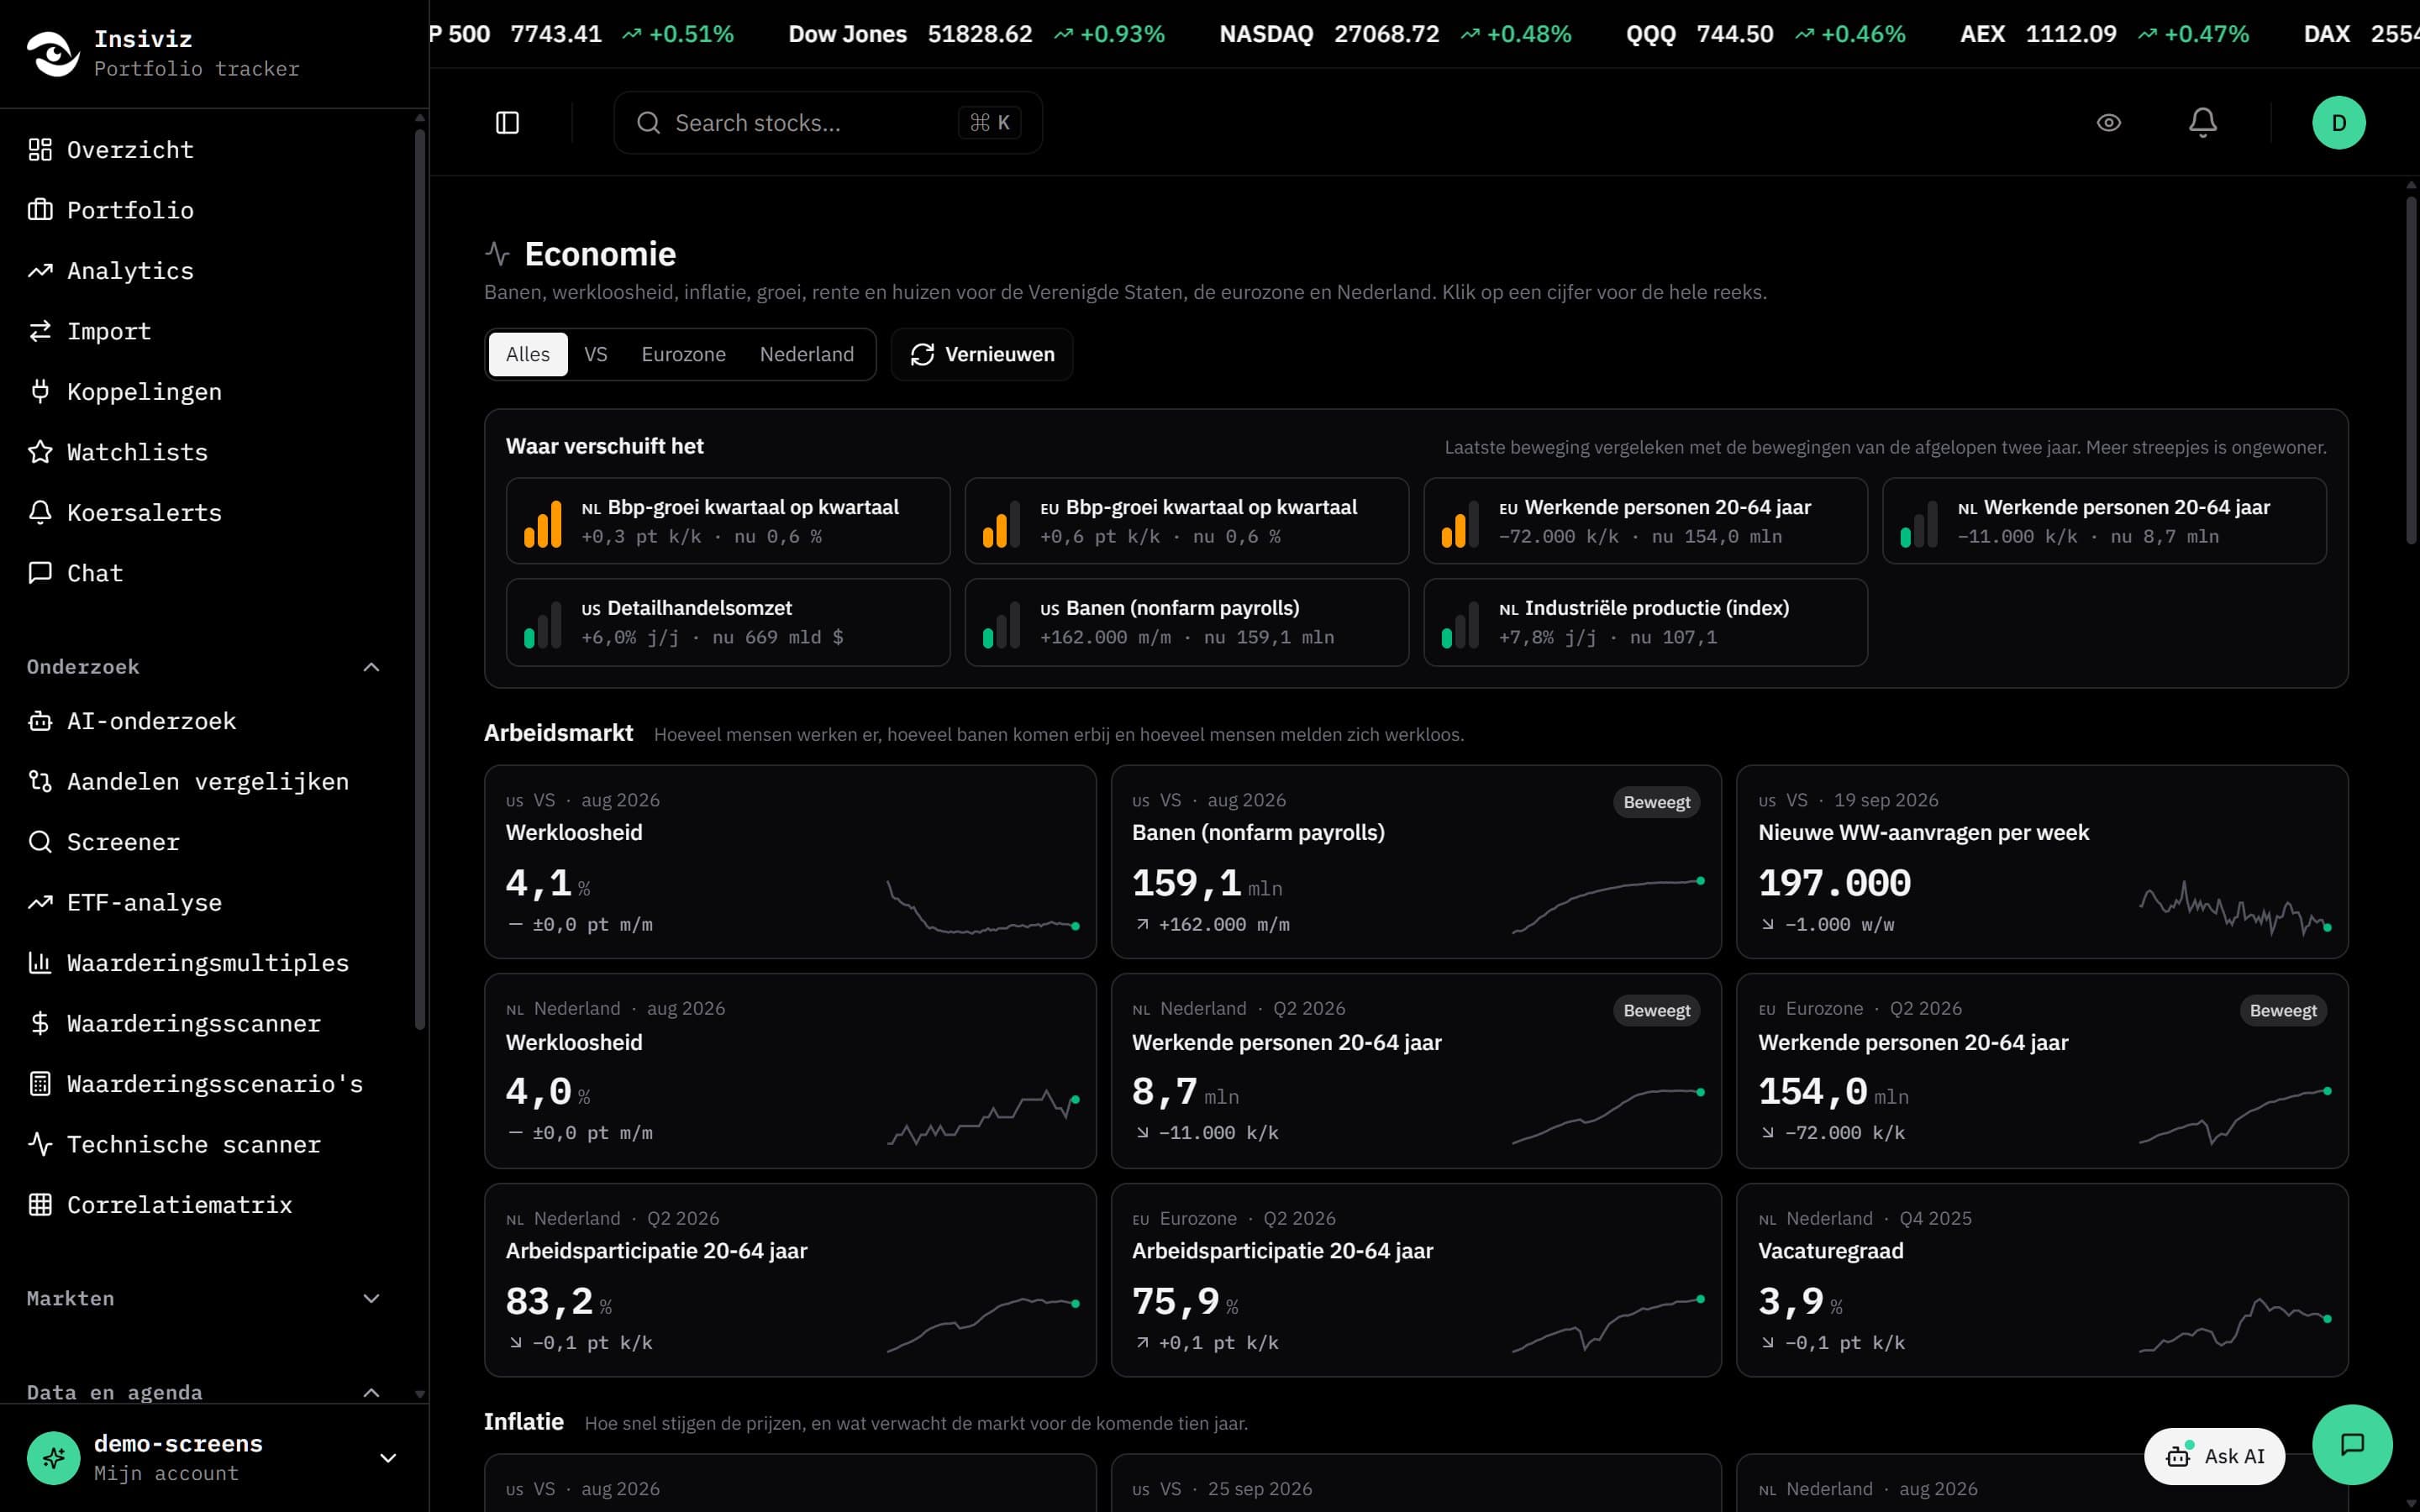
Economy
Jobs, unemployment, inflation, growth, interest rates and housing for the US, the eurozone and the Netherlands. The biggest shifts are at the top.
View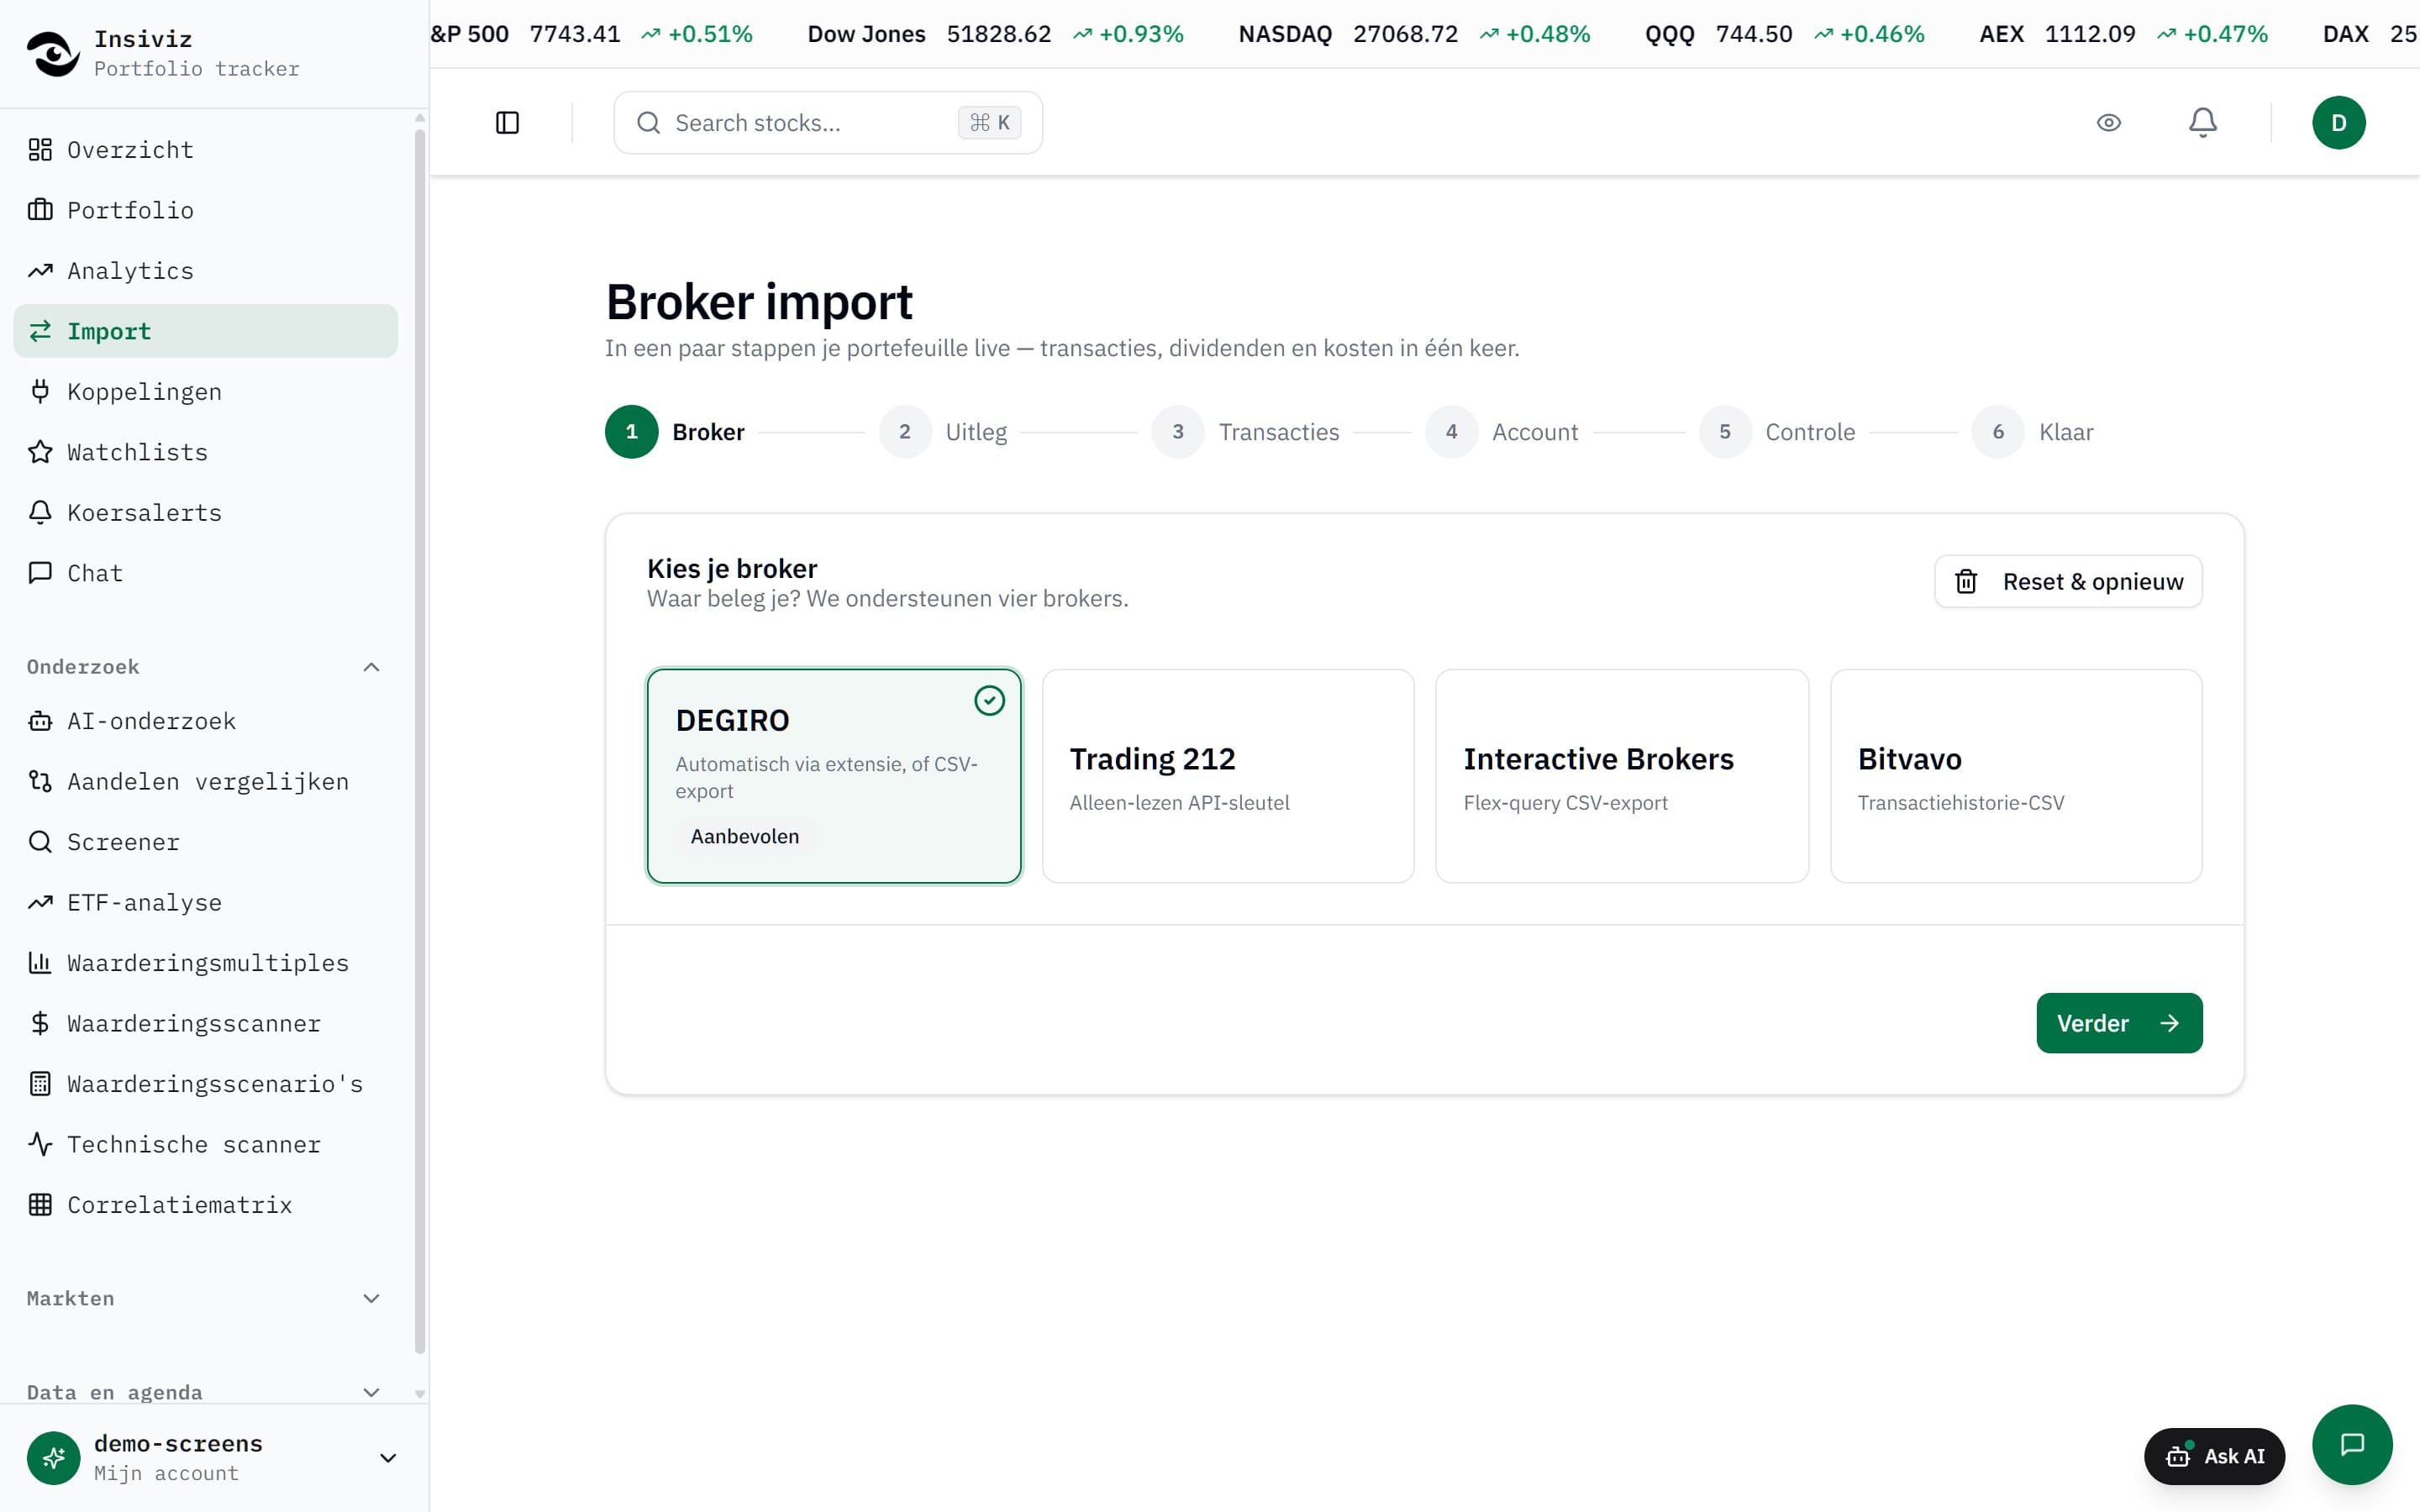
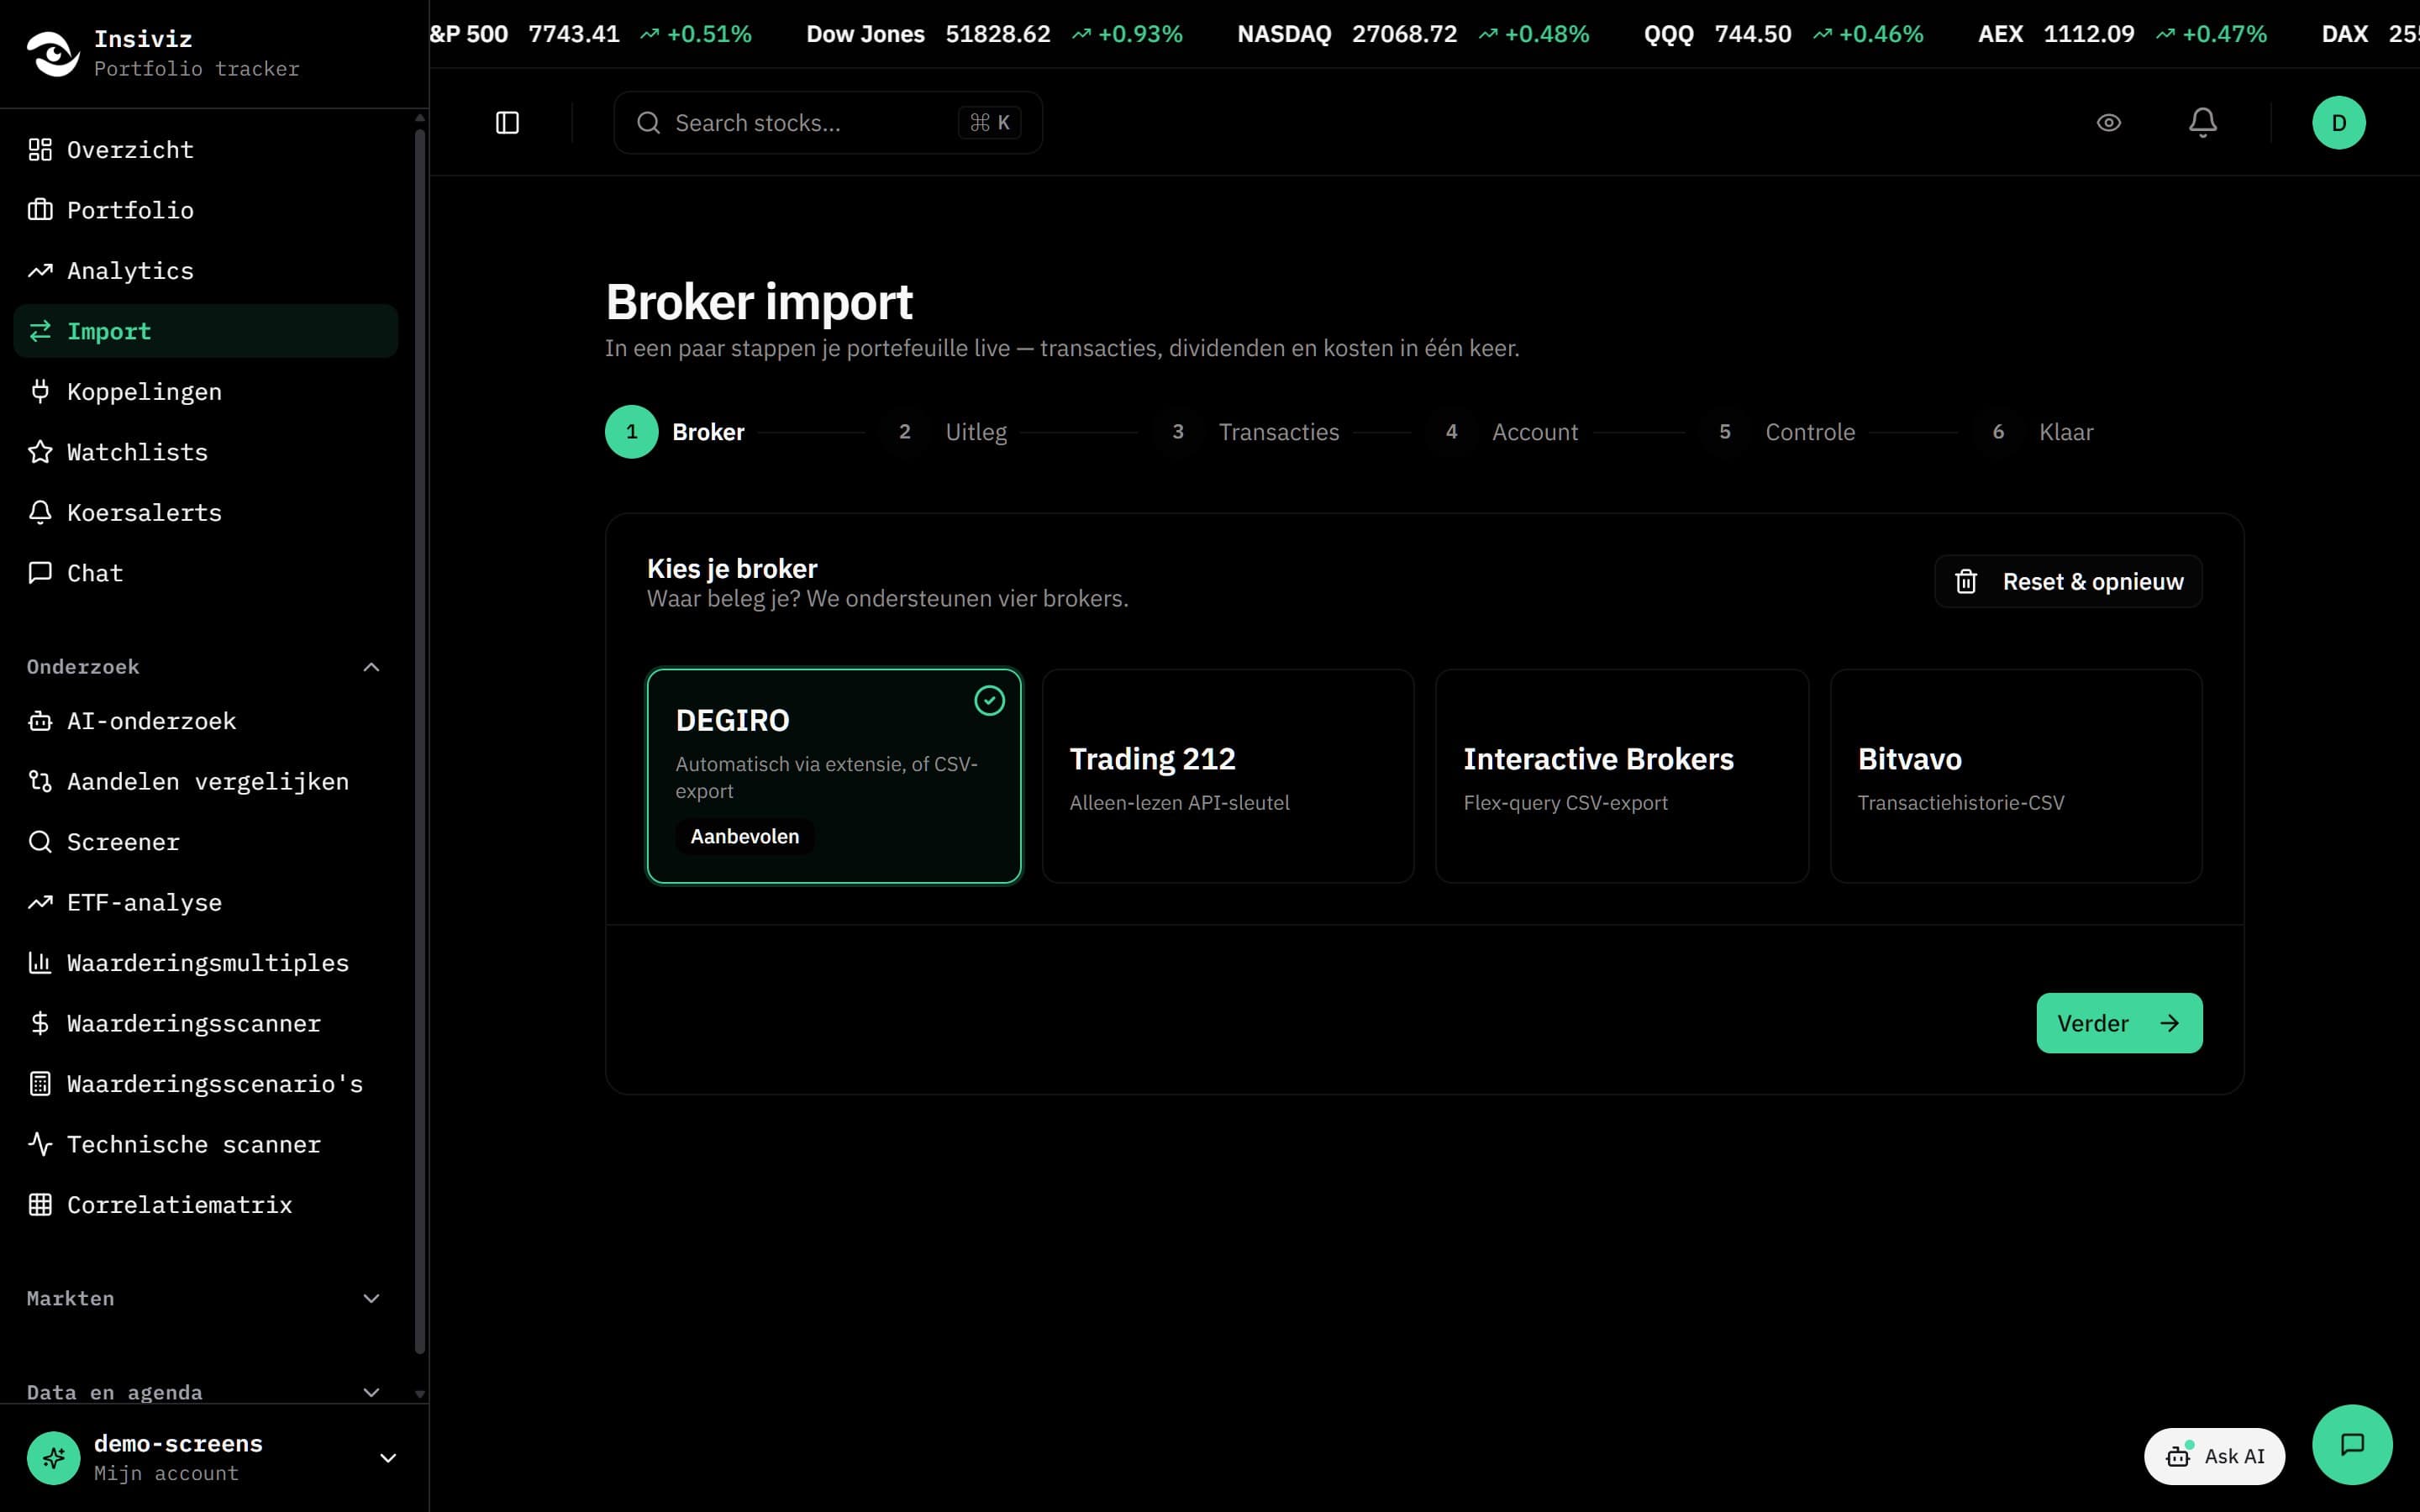
Import and sync
DEGIRO via the browser extension, Trading 212 via a read-only key, Interactive Brokers via Flex query. Everything is in place within a few minutes.
View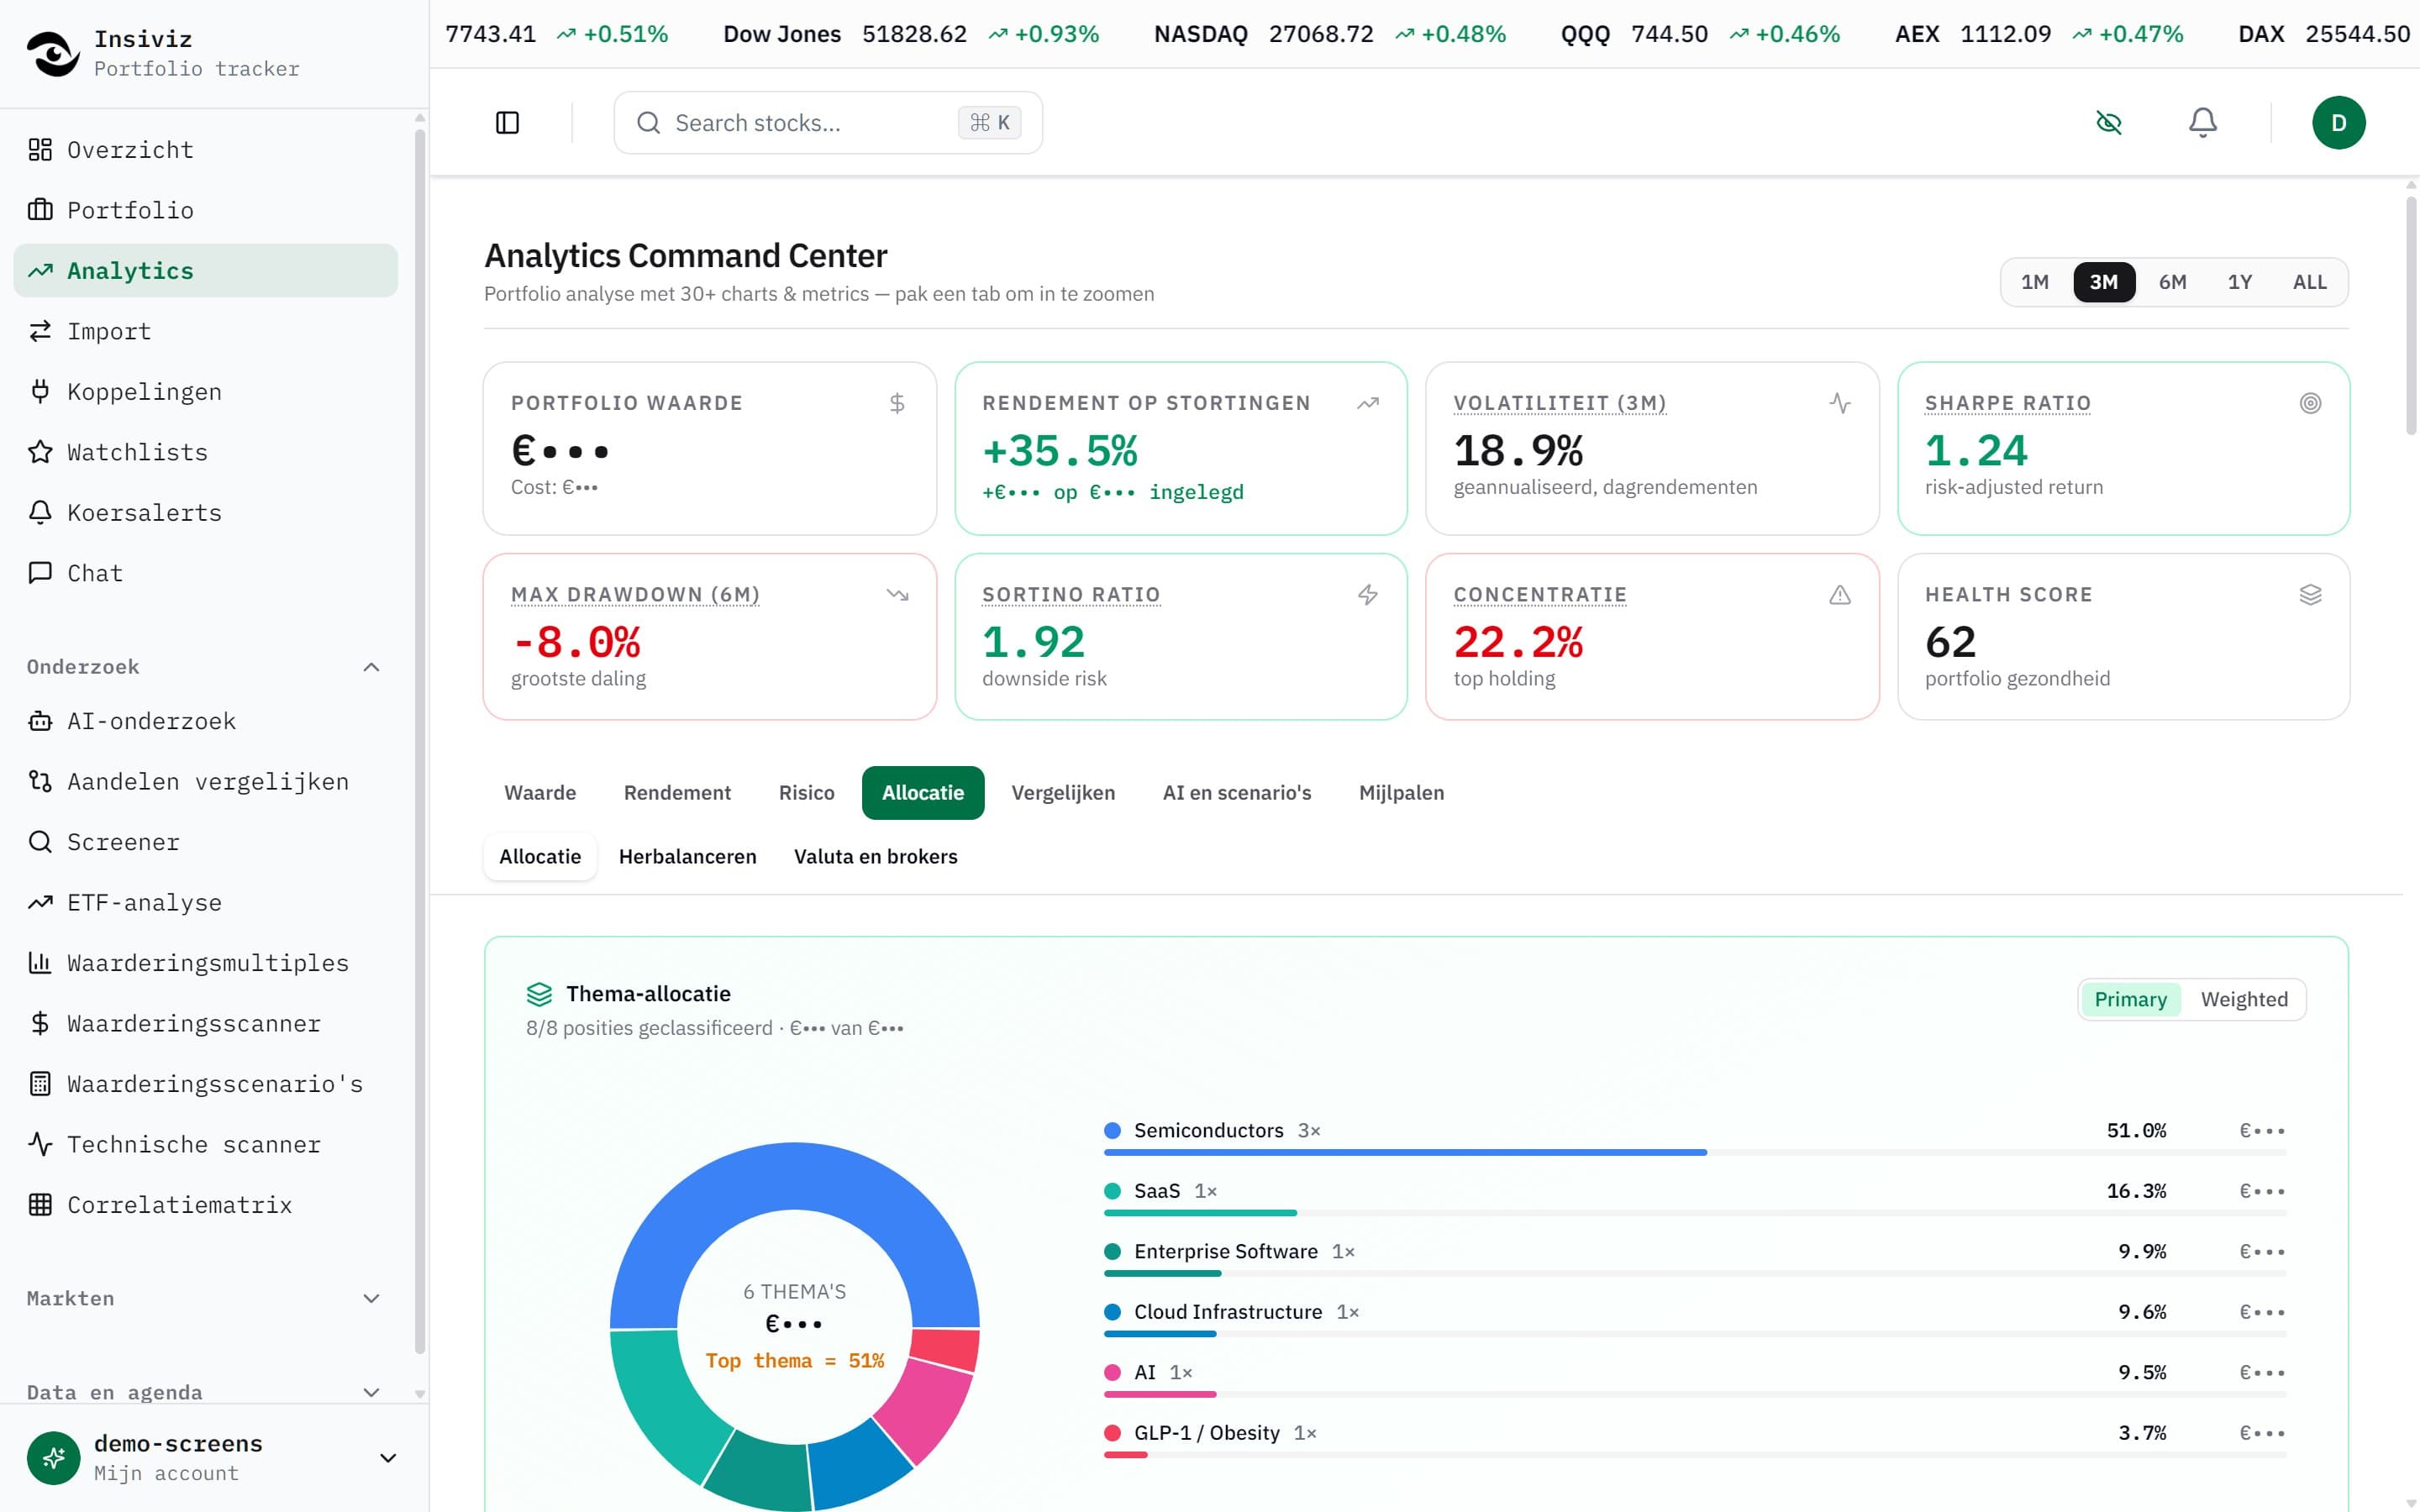
Privacy in your own hands
Hide amounts with one click for a screenshot. Share your portfolio as a link, with a password, or not at all.
ViewAnd 36 other tools
See all 42 featuresHow it works
From export to insight in three steps. Most people are done within ten minutes.
- 1
Import your broker
Upload an export or connect your account. The wizard recognizes the file, shows what is coming in and skips duplicate rows.
- 2
Read your numbers
Return on deposits, costs, dividends and risk per position and for the whole portfolio. With a comparison against the index over the same days.
- 3
Follow what matters
Price alerts, the earnings of your own positions, a daily briefing on your topics and the moves of superinvestors and politicians.
The same money, a different destination
Every deposit put into the S&P 500, the Nasdaq, the AEX or a world index on the same day. So you see in euros what your choices returned, per year and per position.
- Time-weighted return versus the index
- Every position over its own holding period
- What the price did after you sold
- Best and worst days, deposit rhythm, profit buffer
For every type of investor
The same data, different questions. Each entry point leads to its own set of tools.
Dividend investors
- Gross and net dividend per position and per year
- Dividend calendar with ex-dividend and payment dates
- Yield on cost
- Costs and withholding tax made clear
Value investors
- Screener on more than 50 metrics
- Valuation multiples over ten years
- Scenarios with multiple assumptions
- Portfolios of superinvestors
Active investors
- Technical scanner across your entire watchlist
- Price alerts in your inbox
- Most traded and market breadth
- Earnings calendar for your own positions
Insiviz is in beta
No made-up reviews. Just an honest picture of what works today and what's still to come.
Works today
- Import from DEGIRO, Trading 212 and Interactive Brokers
- Update DEGIRO automatically via the browser extension
- Portfolio with return, dividends, costs and analytics
- Superinvestors, politicians and economy, updated daily
- Screener, valuation, technical scanner and market overviews
- Daily briefing on your topics
Coming soon
- More brokers and pension accounts
- English version of all pages
Missing something or spotted a mistake? Let us know, that's what the beta is for.
Data you can build on
- Prices and fundamentals
- Market data for the US and Europe, delayed up to 15 minutes
- Exchange rates
- Daily from the ECB, so everything adds up in euros
- Superinvestors
- 13F filings straight from SEC EDGAR
- Economy
- Eurostat for the Netherlands and the eurozone, US statistical agencies for the US
- Your broker
- We never store passwords; keys are kept encrypted
14 days of Pro free, then you choose
Free tracks your portfolio at no cost. Investor (€7.99), Pro (€16.99) and Edge (€39) per month add analytics, alerts and AI research. Cancel monthly.
Frequently asked questions
Can't find your question? Send a message, we answer personally.
Know exactly where you stand within ten minutes
Import your transactions and Insiviz calculates the rest for you. No payment method required, no advice, just the numbers.